Muhlenberg College Public Health Program - 2023 Pennsylvania Health Survey
The following report examines opinions regarding public health issues in the Commonwealth of Pennsylvania in 2023 and includes an overview of key findings from the 2023 Pennsylvania Health Survey. The survey was conducted in Spring 2023 by the Muhlenberg College Institute of Public Opinion (MCIPO) in conjunction with the Muhlenberg College Public Health Program. The primary authors of this report are Muhlenberg students Cydney Wilson, Anthony Merchlinsky, Cathy Barrish, Matan Kogen, Aviv Campbell, and Professor Chris Borick of the MCIPO.
PDF: Spring 2023 - Muhlenberg College Pennsylvania Health Poll
Key Findings
- The percentage of Pennsylvanians who have positive views of healthcare within the Commonwealth is at the highest level since the beginning of the COVID-19 pandemic in 2020.
- A large majority of adults in the Keystone State believe the state is not doing enough to combat opioid addiction in Pennsylvania.
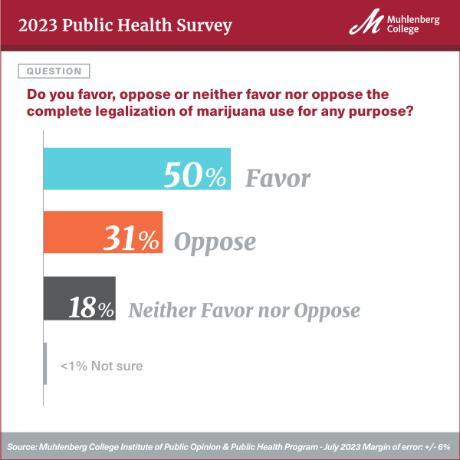
- For the first time in over a decade support for legalization of marijuana in the Keystone State did not increase, with support for this option dropping from 56% in 2022 to 50% in 2023.
- Party affiliation continues to play a major role in behaviors and opinions related to COVID-19 with registered Democrats in Pennsylvania reporting higher vaccination rates and higher levels of concern about the virus in comparison to their Republican counterparts.
- About 4 out of 10 adult Pennsylvanians report that a member of their family has experienced a severe mental health crisis.
- Pennsylvanians under the age of 30 are significantly more likely than those age 30 and older to provide negative ratings of their current mental health condition.
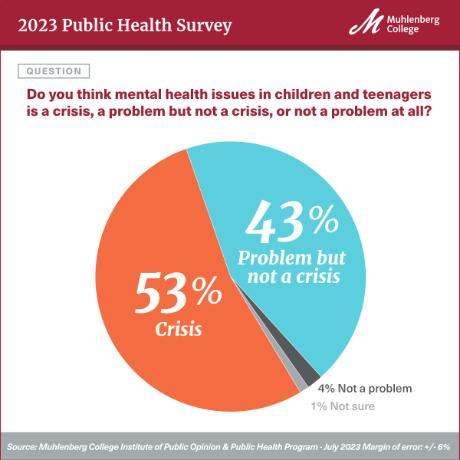
- Over half of Commonwealth residents indicated that mental health issues in children and adolescents are at a crisis level in the state.
- An individual’s marital status is related to ratings of their mental health, with single Pennsylvanians more likely to have negative perceptions of their mental health than those who are married.
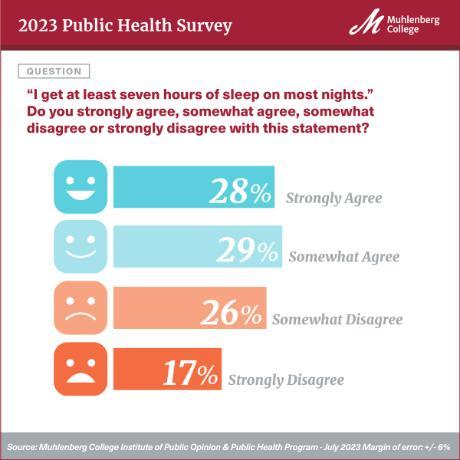
- Over 4 out of 10 Pennsylvanians report that they don’t get at least seven hours of sleep most nights, with those not attaining seven hours less likely to report that their mental health is excellent.
- Perceptions of the threats posed by climate change among Pennsylvanians remain highly shaped by party affiliation, with Democrats much more likely to see this issue as a crisis than their Republican counterparts in the Commonwealth.
OPINIONS ON HEALTH CARE QUALITY IN PENNSYLVANIA
A solid majority of adult Pennsylvanians (66%) describe the general quality of healthcare in the state as either “excellent” or “good.” The percentage of positive ratings is the highest since the COVID-19 pandemic began in 2020, with the 2023 results nearly identical to the 2019 survey finding (See Table One).
TABLE ONE
Resident Perceptions of the Quality of Healthcare in Pennsylvania 2019-2023
|
|
Spring 2019 |
Spring 2020 |
Spring 2021 |
Spring 2022 |
Spring 2023 |
|
Excellent |
20% |
17% |
14% |
13% |
21% |
|
Good |
47% |
42% |
48% |
42% |
45% |
|
Fair |
25% |
24% |
30% |
30% |
25% |
|
Poor |
5% |
16% |
12% |
12% |
7% |
|
Not Sure |
3% |
<1% |
3% |
3% |
1% |
OPIOID USE, ADDICTION AND KNOWLEDGE
Each year the Pennsylvania Public Health Survey examines an array of contemporary health issues. Given the scale of the ongoing opioid crisis in the state, regular attention has been given to this topic. Opioid addiction has plagued the United States for generations, with the number of deaths due to overdose going up by 30% between 2019 and 2020. The Centers for Disease Control (CDC) reported nearly 80,000 opioid-involved drug overdoses in 2022 alone.
Table Two below provides evidence of the continued reach of the opioid epidemic in the Commonwealth of Pennsylvania. In 2023, over half of adult Pennsylvanians indicated that they personally know someone that has been addicted to heroin or another opioid. The latest findings mark the eighth year in a row that a majority of residents in the state reported a personal connection to the ongoing opioid crisis.
TABLE TWO
Do You Personally Know Anyone Who has Been Addicted to Heroin or Another Opiate
2016-2023
|
|
Spring 2016 |
Spring 2017 |
Spring 2018 |
Spring 2019 |
Spring 2020 |
Spring 2021 |
Spring 2022 |
Spring 2023 |
|
Yes |
52% |
58% |
55% |
64% |
63% |
59% |
60% |
55% |
|
No |
44% |
40% |
45% |
34% |
37% |
41% |
40% |
45% |
|
Not Sure |
4% |
2% |
1% |
2% |
<1% |
<1% |
<1% |
0% |
Another indication of the breadth of the opioid problem in the state is the impact across generations of Pennsylvanians. As can be seen in Table Three, large shares of Pennsylvanians in each age category examined report that they personally know someone that has been addicted to an opiate
TABLE THREE
Personal Relationship with Someone Addicted to an Opiate by Age of Respondent
|
|
Yes |
No |
|
18-29 |
52% |
48% |
|
30-49 |
59% |
41% |
|
50-65 |
59% |
41% |
|
Over 65 |
48% |
52% |
The survey findings also suggest that most Pennsylvanians do not believe that enough is being done by the state to address the opioid situation and that this opinion transcends the political divides that are commonly found on many health-related matters. As can be observed in Table Four, large percentages of Democrats, Republicans and Independents believe Pennsylvania is not doing enough to address opioid addiction in the Commonwealth.
TABLE FOUR
Opinion on Pennsylvania’s Efforts to Address Opioid Addiction
by Voter Registration Status
|
|
Doing Enough |
Not Doing Enough |
Not Sure |
|
Democrat |
15% |
75% |
10% |
|
Republican |
18% |
73% |
9% |
|
Independent |
16% |
68% |
16% |
COVID-19
Over the three years since the onset of the COVID-19 pandemic, the views and behaviors of Pennsylvanians regarding this public health threat continue to be significantly shaped by factors such as their political leanings and educational attainment. Respondents' voting status has an influential impact on perceptions of COVID-19, vaccination status, and concerns with the virus. Table Five shows that nearly 20% more registered Democrats have received at least one COVID-19 vaccination shot than registered Republicans. Those who are registered as Independent are situated between those registered with the two major parties.
TABLE FIVE
Voting Status & Vaccination Status (Having Received at Least One Shot)
|
|
Yes |
No |
|
Registered Democrat |
86% |
14% |
|
Registered Republican |
67% |
33% |
|
Independent |
77% |
23% |
Registered voting status does not only affect vaccination status amongst respondents, it also seems to play an influential role in the level of concern related to the virus. Nearly 79% of registered Republican respondents are either not too concerned or not at all concerned about getting seriously ill from COVID-19. In contrast, only 66% of registered Democrats share the same feelings on this matter.
TABLE SIX
Party Affiliation & Concern about Getting Seriously Sick from COVID-19
|
|
Very Concerned |
Somewhat Concerned |
Not Too Concerned |
Not At All Concerned |
|
Democrat |
7% |
27% |
29% |
37% |
|
Republican |
4% |
18% |
33% |
46% |
|
Independent |
3% |
23% |
34% |
40% |
Levels of education also appear to play an influential role in COVID-19 vaccination status in Pennsylvania. There is a linear relationship between education level and vaccination status in the state, as those with higher levels of education maintain higher levels of vaccination. Those with graduate or professional degrees are 24 percentage points more likely to have received at least one COVID-19 vaccination compared to those with a high school degree or less educational attainment.
TABLE SEVEN
Educational Attainment & COVID-19 Vaccination Status
|
|
Yes |
No |
|
High School Graduate or Less |
70% |
30% |
|
Some College Or Tech School |
73% |
27% |
|
College Graduate |
82% |
17% |
|
Graduate or Professional Degree |
94% |
6% |
MENTAL HEALTH
Issues of mental health have come to the forefront of public discussions in recent years, as more attention has been paid to what some call an epidemic of mental health struggles. The following section details the relationship between a number of demographic variables and various aspects of one’s personal mental health or perception of mental health in the state.
Pennsylvanians with lower levels of educational attainment are less likely to provide a positive rating of their mental health than those with higher levels of formal education. Sixty-nine percent of those surveyed who have a high school education or less viewed their mental health as “excellent” or “good.” This number increases to 81% for those with some college or tech school, 82% for college graduates, and 89% for those with a graduate or professional degree. Ultimately, as one’s level of education increased so did their own perception of their mental health. Given the correlation between higher levels of education and stability such as housing and income, it follows that mental health conditions may be enhanced for these groups.
TABLE EIGHT
Perception of One’s Own Mental Health by Level of Education
|
|
Excellent |
Good |
Only Fair |
Poor |
|
High School Graduate or Less |
19% |
50% |
23% |
8% |
|
Some College Or Tech School |
33% |
48% |
15% |
3% |
|
College Graduate |
24% |
58% |
16% |
3% |
|
Graduate or Professional Degree |
28% |
61% |
10% |
2% |
Public health experts have raised increasing concerns about the mental health of younger individuals, with evidence pointing to a rising prevalence of mental health challenges among adolescents and younger adults. The survey results indicate that among Pennsylvanians, individual perceptions of mental health are affected by the age of the individual. Those who are in the youngest age group surveyed, 18-29, had the lowest perception of their mental health, with 65% viewing their mental health as “excellent” or “good,” compared with 82% of those aged 30 or above. Over 1 in 3 Pennsylvanians (35%) under the age of 30 viewed their own mental health as only “fair” or “poor.”
TABLE NINE
Perception of One’s Mental Health by Age
|
|
Excellent |
Good |
Only Fair |
Poor |
|
18-29 |
17% |
48% |
26% |
9% |
|
Over 30 |
27% |
55% |
15% |
3% |
Perceptions of mental health are also significantly related to the income level of Pennsylvanians. Residents of the Commonwealth with higher incomes are more likely to report positive mental health than those with lower income levels. As can be seen in Table Ten, 62% of those making under $20,000 view their mental health as “excellent” or “good,” compared with about three quarters of those making between $20,000 and $80,000, and over 85% of those making over $100,000. While it may be true that money can’t buy happiness, access to essentials such as housing, food, and clothing can impact one’s general perception of their mental health. For Pennsylvanians living under or near the poverty line, feelings of emotional well-being may be diminished.
TABLE TEN
Perception of One’s Own Mental Health by Income
|
|
Excellent |
Good |
Only Fair |
Poor |
|
Under $20,000 |
17% |
45% |
19% |
19% |
|
$20,000-$40,000 |
25% |
49% |
23% |
3% |
|
$40,000-$60,000 |
21% |
55% |
21% |
4% |
|
$60,000-$80,000 |
19% |
60% |
17% |
4% |
|
$80,000-$100,000 |
33% |
53% |
14% |
0% |
|
Over $100,000 |
35% |
52% |
11% |
3% |
Previous research has shown that married individuals are more likely to report positive views on mental health than their single counterparts. This survey of adult Pennsylvanians produced findings that largely align with past studies conducted at the national level. Single residents of the Keystone State are over twice as likely (31% to 14%) as their married counterparts to describe their mental health as “fair” or “poor.”
TABLE ELEVEN
Perception of One’s Own Mental Health by Marital Status
|
|
Excellent |
Good |
Only Fair |
Poor |
|
Single |
19% |
50% |
23% |
8% |
|
Married/Partnered |
32% |
54% |
12% |
2% |
SLEEP AND MENTAL HEALTH
The 2023 Pennsylvania Public Health survey examined the hours of sleep that residents of the state report receiving most nights. As can be observed in Table Twelve, a little over half (57%) of Pennsylvanians agree (either strongly or somewhat) that they get at least seven hours of sleep most nights. Given that the American Academy of Sleep Medicine recommends that adults aged 18-60 sleep at least seven hours of sleep each night to promote optimal health and well-being, it is noteworthy that more than 4 in 10 adult Pennsylvanians state that they do not regularly achieve this standard.
TABLE TWELVE
Agreement Levels with Statement, “I Get at least Seven Hours of Sleep on Most Nights”
|
Response |
Percentage |
|
Strongly Agree |
28% |
|
Somewhat Agree |
29% |
|
Somewhat Disagree |
26% |
|
Strongly Disagree |
17% |
Given the importance of sleep to overall well-being, it may not be surprising that among Pennsylvanians that report more negative overall mental health, there is a lower likelihood of getting 7 hours of sleep most nights. The results in Table Thirteen indicate that Pennsylvanians who strongly agree that they get at least seven hours of sleep per night are most likely (36%) to report their own mental health as “excellent.”
TABLE THIRTEEN
Level of Agreement with Getting at Least 7 Hours of Sleep Per Night and Individual Ratings of Their Mental Health
|
|
Excellent |
Good |
Fair |
Poor |
|
Strongly Agree |
36% |
48% |
12% |
4% |
|
Somewhat Agree |
18% |
55% |
23% |
4% |
|
Somewhat Disagree |
26% |
59% |
13% |
3% |
|
Strongly Disagree |
18% |
49% |
25% |
7% |
CLIMATE CHANGE
As it has done in past iterations, the Pennsylvania Public Health Survey explored aspects of resident perceptions of climate change in the 2023 version of the project. In this study, residents were asked to identify their view of climate change as an issue. The results presented in Table Fourteen indicate that over two out of three Pennsylvanians (67%) consider climate change to be either a “crisis” (29%) or a “problem (38%), with about one in four (28%) stating that this issue is “not a problem.”
TABLE FOURTEEN
Views on Climate Change as an Issue
|
Response |
Percentage |
|
Crisis |
29% |
|
A Problem but not a Crisis |
38% |
|
Not a Problem |
28% |
|
Not Sure |
4% |
Perceptions of the threat level that climate change poses are affected by a number of individual-level characteristics such as age, gender identity, and political party affiliation. The findings presented in Table Fifteen show that Pennsylvanians under the age of 30 are modestly more likely to refer to climate change as a “crisis” than their counterparts age 30 and older, and also less likely to think this issue is “not a problem.” This finding is generally in line with past research on national climate change opinions with a May 2021 PEW study finding that Gen Z Americans (those born after 1996) were the most likely group to consider climate change their top concern.
TABLE FIFTEEN
Levels of Concern over Climate Change by Age
|
|
Crisis |
A Problem but not a Crisis |
Not a Problem |
Not Sure |
|
Ages 18-29 |
36% |
42% |
16% |
7% |
|
Ages 30-49 |
29% |
34% |
35% |
2% |
|
Ages 50-65 |
25% |
39% |
33% |
3% |
|
Ages Over 65 |
29% |
41% |
25% |
5% |
Female Pennsylvanians are 9 percentage points more likely to consider climate change a crisis than their male counterparts. This finding is in line with past national-level research on climate change opinions. For example, a PEW study found that women were 17% more likely than men to consider climate change “a serious problem.”
TABLE SIXTEEN
Levels of Concern over Climate Change by Gender Identity
|
|
Crisis |
A Problem but not a Crisis |
Not a Problem |
Not Sure |
|
Male |
24% |
42% |
32% |
2% |
|
Female |
33% |
35% |
25% |
7% |
While individual-level characteristics such as age and gender have been shown to affect perceptions of climate change both in this study and in broader national surveys, party affiliation has been regularly shown to have the most significant impact on how a person views this matter. The findings from the 2023 Pennsylvania Public Health Survey add to these previous studies, with Pennsylvania Democrats shown to be over four times as likely to consider climate change to be a crisis as Republicans in the Commonwealth.
TABLE SEVENTEEN
Levels of Concern over Climate Change by Party Affiliation
|
|
Crisis |
A Problem but not a Crisis |
Not a Problem |
Not Sure |
|
Democrat |
46% |
34% |
16% |
4% |
|
Republican |
11% |
39% |
46% |
5% |
|
Other |
28% |
44% |
23% |
5% |
Over the past several decades as climate change has emerged as an imminent threat, there has been increased attention to the concept of “climate anxiety.” The Handbook of Climate Psychology defines climate anxiety as “heightened emotional, mental or somatic distress in response to dangerous changes in the climate system.”[1] Table Eighteen explores the relationship between perceptions of climate change and a Pennsylvanians’ self-reported mental health status. As can be observed, 16% of Pennsylvanians who view climate change as a crisis view their mental health as excellent, compared with 37% of those who view climate change as not a problem. This finding does not imply that concern with climate change is undermining the overall mental health of Pennsylvanians, but the results do identify a connection worthy of added examination as climate anxiety is more fully explored.
TABLE EIGHTEEN
Perception of One’s Own Mental Health/Emotional Well-Being by Climate Change as a Crisis
|
|
Excellent |
Good |
Only Fair |
Poor |
|
Crisis |
16% |
57% |
18% |
9% |
|
A problem but not a crisis |
23% |
59% |
16% |
3% |
|
Not a problem |
37% |
44% |
17% |
2% |
MARIJUANA LEGALIZATION
Over the last decade, the Pennsylvania Public Health Survey has regularly explored public support for the legalization of marijuana in the Commonwealth. Over that period of time support for legalization steadily rose from 33% in 2013 to 56% in 2022, with opposition dropping from 40% to 25% over the same time frame. However, in the latest version of the survey, support for legalization dropped 6 points to 50% while opposition rose from 25% to 31%. The small shift in opinion on this matter may simply be the product of sampling error, but for the first time in a decade support for legalization did not rise in the Commonwealth.
TABLE NINETEEN
Support for the Legalization of Marijuana in Pennsylvania
|
|
2013 |
2014 |
2016 |
2017 |
2018 |
2019 |
2020 |
2021 |
2022 |
2023 |
|
Favor |
33% |
38% |
39% |
45% |
49% |
51% |
56% |
58% |
56% |
50% |
|
Oppose |
40% |
35% |
38% |
29% |
30% |
28% |
26% |
26% |
25% |
31% |
|
Neither Favor nor Oppose |
24% |
22% |
20% |
23% |
19% |
18% |
12% |
14% |
18% |
18% |
|
Not Sure |
3% |
4% |
3% |
3% |
3% |
3% |
6% |
3% |
1% |
<1% |
[1] https://www.ncbi.nlm.nih.gov/pmc/articles/PMC8499625/
Methodological Statement
This report provides the results of a telephone survey of 417 adult residents in the Commonwealth of Pennsylvania. Interviews were conducted between March 21 and April 6, 2023. Respondents were interviewed in English on both landlines and cell phones. With a randomly selected sample of respondents, the margin of error for the surveys is +/- 6% at a 95% level of confidence. Margins of error for questions with smaller sample size will be larger. In addition to sampling error, one should consider that question wording and other fielding issues can introduce error or bias into survey results. The data has been weighted to gender, age, race, and educational attainment to 2023 population parameters for the Commonwealth of Pennsylvania provided by the United States Census Bureau. The calculation of sampling error takes into account design effects due to the weighting of the sample to the population parameters identified above. In order to reach a representative sample of Pennsylvania adult residents, landlines and cell phones were called up to 3 times. Interviews were conducted by Communication Concepts of Easton Pennsylvania. Due to rounding, the totals provided in the frequency report may not total 100 percent. Data analysis and weighting were conducted through the use of the SPSS statistical software package Version 29.0. The survey instrument was designed by Dr. Christopher P. Borick of the Muhlenberg College Institute of Public Opinion (MCIPO) in conjunction with the Muhlenberg College Public Health Program. The survey was funded by the MCIPO. For more detailed information on the methods employed please contact the MCIPO at 484-664-3444 or email Dr. Borick at [email protected].
INSTRUMENT AND FREQUENCY REPORT
SCREENER: Thank you. Just to confirm: Are you a resident of Pennsylvania who is age 18 or older?
- Yes…………..…..CONTINUE
- No………………THANK AND DISCONTINUE
- Not Sure….……. THANK AND DISCONTINUE
(GENERAL HEALTH CARE)
Q1: In general, would you describe the quality of health care in Pennsylvania as excellent, good, fair or poor?
1. Excellent………..21%
2. Good……..……..45%
3. Fair……………..25%
4. Poor……………. 7%
98. Not Sure (VOL)..1%
|
|
Spring 2019 |
Spring 2020 |
Spring 2021 |
Spring 2022 |
Spring 2023 |
|
Excellent |
20% |
17% |
14% |
13% |
21% |
|
Good |
47% |
42% |
48% |
42% |
45% |
|
Fair |
25% |
24% |
23% |
30% |
25% |
|
Poor |
5% |
16% |
12% |
12% |
7% |
|
Not Sure |
3% |
<1% |
4% |
3% |
1% |
Q2: In general, would you describe the health care YOU have received in the last year as excellent, good, fair or poor?
1. Excellent………….29%
2. Good……..……….48%
3. Fair……………….18%
4. Poor……………… 5%
98. Not Sure (VOL)....<1%
(MARIJUANA AND OPIOIDS)
Q3: Next, I would like to ask you a question about marijuana. First, do you favor, oppose, or neither favor nor oppose the complete legalization of the use of marijuana for any purpose?
1. Favor………………………50%
2. Oppose…………………….31%
3. Neither Favor nor Oppose….18%
98. Not Sure (VOL)………….<1%
|
|
Spring 2013 |
Spring 2014 |
Spring 2016 |
Spring 2017 |
Spring 2018 |
Spring 2019 |
Spring 2020 |
Spring 2021 |
Spring 2022 |
Spring 2023 |
|
Favor |
33% |
38% |
39% |
45% |
49% |
51% |
56% |
58% |
56% |
50% |
|
Oppose |
40% |
35% |
38% |
29% |
30% |
28% |
26% |
26% |
25% |
31% |
|
Neither Favor nor Oppose |
24% |
22% |
20% |
23% |
19% |
18% |
12% |
14% |
18% |
18% |
|
Not Sure |
3% |
4% |
3% |
3% |
3% |
3% |
6% |
3% |
1% |
<1% |
Q4: The National Institutes of Health has found that marijuana use among individuals between the ages of 18 and 22 has dramatically increased in the United States over recent years. Are you very concerned, somewhat concerned, not too concerned, or not at all concerned about increased marijuana use among individuals between the ages of 18 and 22?
- Very Concerned……………..22%
- Somewhat Concerned……….33%
- Not Too Concerned………….27%
- Not at All Concerned ……….18%
Q5: Next I have a few questions about opioids. In the community you live in is opioid abuse a major problem, moderate problem, minor problem or not a problem at all?
1. Major Problem…………… 25%
2. Moderate Problem……….. 37%
3. Minor Problem…………… 21%
4. Not a Problem at All………10%
98. Not Sure…………………... 7%
Q6: Do you personally know anyone who has been addicted to heroin or another opiate?
1. Yes………………..55%
2. No………………... 45%
|
|
Spring 2016 |
Spring 2017 |
Spring 2018 |
Spring 2019 |
Spring 2020 |
Spring 2021 |
Spring 2022 |
Spring 2023 |
|
Yes |
52% |
58% |
55% |
64% |
63% |
59% |
60% |
55% |
|
No |
44% |
40% |
45% |
34% |
37% |
41% |
40% |
45% |
|
Not Sure |
4% |
2% |
1% |
2% |
<1% |
<1% |
<1% |
0% |
Q7: Do you think that Pennsylvania is doing enough, or not doing enough to address opioid abuse in the state?
1. Doing Enough………….16%
2. Not Doing Enough……..73%
98. Not Sure……………….. 11%
(COVID-19)
Q8: Next I have a few questions about COVID-19. Have you received at least one COVID-19 vaccine shot at this time?
- Yes …………………….77%
- No………………………23% (SKIP TO Q11)
- Not Sure……………….. <1% (SKIP TO Q11)
|
|
Spring 2021 |
Fall 2021 |
Spring 2022 |
Spring 2023 |
|
Yes |
36% |
74% |
78% |
77% |
|
No |
64% |
26% |
21% |
23% |
|
Not Sure (VOL) |
1% |
0% |
1% |
<1% |
(NOTE Q9 PERCENTAGES ARE ONLY FOR THOSE WHO RECEIVED AT LEAST ONE COVID VACCINATION)
Q9: Are you partially vaccinated, meaning you received just one dose of a two-dose vaccine, are you fully vaccinated but have not received a booster, or are you fully vaccinated and have also received at least one booster shot?
- One Dose………………………………………… 2% (SKIP TO Q11)
- Fully Vaccinated No Booster……………………. 37% (SKIP TO Q11)
- Fully Vaccinated With At Least One Booster…… 62%
Q10: Have you received a dose of the new, updated COVID-19 booster, sometimes called a bivalent booster, that has been available since early September?
1. Yes………. 48%
2. No………. 51%
98. Not Sure…. 1%
Q11: How worried, if at all, are you that you will get seriously sick from COVID-19. Are you very concerned, somewhat concerned, not too concerned, or not at all concerned about getting seriously sick from COVID-19?
- Very Concerned…………….. 5%
- Somewhat Concerned………. 22%
- Not Too Concerned………… 32%
- Not at All Concerned ………. 41%
(MENTAL HEALTH)
Q12: Next, I have a few questions about mental health. How would you describe your own mental health or emotional well-being at this time? Would you say it is excellent, good, only fair, or poor?
- Excellent…………… 25%
- Good……………….. 53%
- Only Fair…………… 17%
- Poor…………………. 4%
|
|
Spring 2021 |
Spring 2022 |
Spring 2023 |
|
Excellent |
33% |
35% |
25% |
|
Good |
45% |
44% |
53% |
|
Only Fair |
19% |
17% |
17% |
|
Poor |
3% |
4% |
4% |
|
Not Sure |
1% |
<1% |
0% |
Q13: Compared to 12 months ago, would you say your mental health or emotional well-being is much better, somewhat better, somewhat worse, much worse or about the same as a year ago?
- Much Better………………………….10%
- Somewhat Better……………………. 26%
- Somewhat Worse…………………… 10%
- Much Worse…………………………. 3%
- About the Same as a Year Ago………51%
|
|
Spring 2021 |
Spring 2022 |
Spring 2023 |
|
Much Better |
9% |
12% |
10% |
|
Somewhat Better |
17% |
19% |
26% |
|
Somewhat Worse |
18% |
9% |
10% |
|
Much Worse |
4% |
3% |
3% |
|
About the Same as a Year Ago |
53% |
56% |
51% |
|
Not Sure |
<1% |
0% |
0% |
Q14: Have any members of your family ever experienced a severe mental health crisis?
1. Yes…………… 39%
2. No……………. 60%
98. Not Sure……… 1%
(PUBLIC HEALTH ISSUES)
Q15: Please indicate if you strongly agree, somewhat agree, somewhat disagree or strongly disagree with the following statements. First, the chances of a child getting autism are increased if they receive the recommended childhood immunizations.
1. Strongly Agree………..… 5%
2. Somewhat Agree…………15%
3. Somewhat Disagree…….. 28%
4. Strongly Disagree………. 42%
98. Not Sure (Vol)…………. 11%
|
|
Spring 2013 |
Spring 2014 |
Spring 2015 |
Spring 2016 |
Spring 2017 |
Spring 2018 |
Spring 2019 |
Spring 2020 |
Spring 2021 |
Spring 2022 |
Spring 2023 |
|
Strongly Agree |
5% |
8% |
7% |
6% |
4% |
8% |
9% |
8% |
5% |
7% |
5% |
|
Somewhat Agree |
13% |
13% |
10% |
13% |
13% |
13% |
9% |
8% |
6% |
8% |
15% |
|
Somewhat Disagree |
22% |
21% |
22% |
16% |
14% |
14% |
16% |
13% |
12% |
26% |
28% |
|
Strongly Disagree |
35% |
39% |
48% |
51% |
48% |
49% |
55% |
57% |
52% |
41% |
42% |
|
Not Sure |
26% |
19% |
12% |
14% |
21% |
16% |
11% |
15% |
25% |
18% |
11% |
Q16: Immunizations pose little health risks to those that receive them.
1. Strongly Agree………..… 41%
2. Somewhat Agree………. 40%
3. Somewhat Disagree……. 15%
4. Strongly Disagree………. 3%
98. Not Sure (Vol)…………. 2%
|
|
Spring 2019 |
Spring 2020 |
Spring 2021 |
Spring 2022 |
Spring 2023 |
|
Strongly Agree |
54% |
49% |
41% |
41% |
41% |
|
Somewhat Agree |
23% |
25% |
30% |
34% |
40% |
|
Somewhat Disagree |
9% |
8% |
9% |
12% |
15% |
|
Strongly Disagree |
9% |
8% |
3% |
10% |
3% |
|
Not Sure |
4% |
10% |
17% |
4% |
2% |
Q17: Misinformation about health issues is a major problem in the United States.
1. Strongly Agree………..…. 60%
2. Somewhat Agree………… 30%
3. Somewhat Disagree………. 8%
4. Strongly Disagree………… 1%
98. Not Sure (Vol)…………….2%
Q18: I get at least seven hours of sleep on most nights.
1. Strongly Agree………..… 28%
2. Somewhat Agree……….. 29%
3. Somewhat Disagree…….. 26%
4. Strongly Disagree………. 17%
(THREATS TO PUBLIC HEALTH)
Q:19 Next, I’m going to read a list of issues in Pennsylvania today. For each issue I mention please indicate if you think the issue is a crisis, a problem but not a crisis, or not a problem at all. First, (ROTATE QUESTIONS)
Obesity
1. Crisis……………………….…35%
2. A problem but not a crisis……60%
3. Not a problem……………….. 4%
98. Not sure……………………. 1%
Q20: Mental health issues in children and teenagers
1. Crisis……………………………………53%
2. A problem but not a crisis………43%
3. Not a problem…………………………2%
98. Not sure……………………………….1%
Q21: Climate change
1. Crisis…………………………………… 29%
2. A problem but not a crisis………38%
3. Not a problem………………………….. 28%
98. Not sure………………………………. 4%
Q22: Anxiety or depression in adults
1. Crisis……………………………………49%
2. A problem but not a crisis………48%
3. Not a problem………………………….3%
98. Not sure……………………………….1%
Q23: Loneliness
1. Crisis……………………………………. 19%
2. A problem but not a crisis……….60%
3. Not a problem……………………………16%
98. Not sure………………………………… 4%
(DEMOGRAPHICS)
Q24: Finally, I have a few questions about yourself. First, what is your current marital status?
|
|
|
|
Single |
35% |
|
Married |
45% |
|
Separated |
2% |
|
Divorced |
10% |
|
Widowed |
7% |
|
Partnered |
2% |
Q25: What is your highest level of education? Is it (READ LIST)?
|
|
|
|
Less Than High School |
2% |
|
High School Graduate |
31% |
|
Some College Or Technical School |
28% |
|
College Graduate (4 Yr Only) |
26% |
|
Graduate Or Professional Degree |
12% |
Q26: Which of the following categories best describes your racial identity? (READ LIST)
|
|
|
|
White/Caucasian |
73% |
|
Black |
11% |
|
Hispanic |
6% |
|
Latino |
3% |
|
Asian |
2% |
|
Native American |
<1% |
|
Mixed Race |
4% |
|
Or Other |
1% |
Q27: Which of the following categories best describes your current voting status? Are you registered as a (READ LIST)?
|
|
|
|
Democrat |
43% |
|
Republican |
37% |
|
Independent |
15% |
|
Other Party |
1% |
|
Or Not Registered To Vote In Pennsylvania |
4% |
Q28: Which of the following categories best describes your religious affiliation? Are you (READ LIST)?
|
|
|
|
Catholic |
27% |
|
Protestant |
31% |
|
Jewish |
3% |
|
Muslim |
1% |
|
Hindu |
1% |
|
Other Religion (Including Agnostic) |
33% |
|
Atheist |
5% |
Q29: Do you have children under the age of 18?
|
|
|
|
Has Children Under 18 |
24% |
|
No Children Under 18 |
76% |
Q30: Which of the following best describes your health care insurance status. Are you primarily insured:
|
|
|
|
By A Plan Provided By Your Employer |
56% |
|
By A Plan That You Purchase Individually |
6% |
|
By Medicaid Coverage |
6% |
|
By Medicare Coverage |
22% |
|
Uninsured |
2% |
|
Other |
6% |
|
Not Sure |
<1% |
Q31: In which of the following age categories does your current age fall. READ LIST
|
|
|
|
18-29 |
21% |
|
30-49 |
31% |
|
50-65 |
26% |
|
Or Over 65 |
22% |
Q32: Which of the following categories best describes your family income? (READ LIST)
|
|
|
|
Under $20,000 |
11% |
|
$20,000-$40,000 |
16% |
|
$40,000-$60,000 |
20% |
|
$60,000-$80,000 |
20% |
|
$80,000-$100,000 |
13% |
|
Over $100,000 |
19% |
|
Not Sure |
2% |
Q33: Finally, to which gender identity do you most identify? (READ LIST)
|
|
|
|
Male |
49% |
|
Female |
50% |
|
Transgender Male |
0% |
|
Transgender Female |
0% |
|
Or you do not identify as male, female or transgender |
1% |