
Muhlenberg College/Morning Call
Pennsylvania Presidential Election Survey
SEPTEMBER 2024
PDF: Muhlenberg College/Morning Call Pennsylvania Presidential Election Survey September 2024
Key Findings:
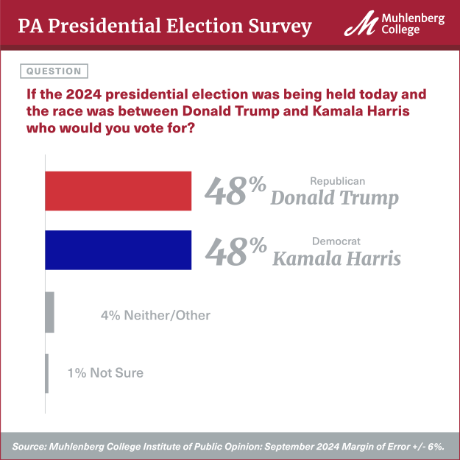
- In the latest Muhlenberg College/Morning Call poll of the 2024 election season, former President Donald Trump and Vice President Kamala Harris are locked in a 48% to 48% tie in their contest to secure Pennsylvania’s coveted 19 Electoral College votes.
- A large gender gap is a defining feature of the presidential race in the Keystone State with Trump holding a 59% to 36% lead among male voters and Harris holding a 59% to 38% among female voters.
- As with gender, a large educational attainment divide is playing out in the 2024 race with Trump maintaining a 19 point advantage (58% to 37%) over Harris among voters without a four year college degree, with Harris holding a 32 point lead (65% to 33%) over Trump among Pennsylvania voters with a four year college degree.
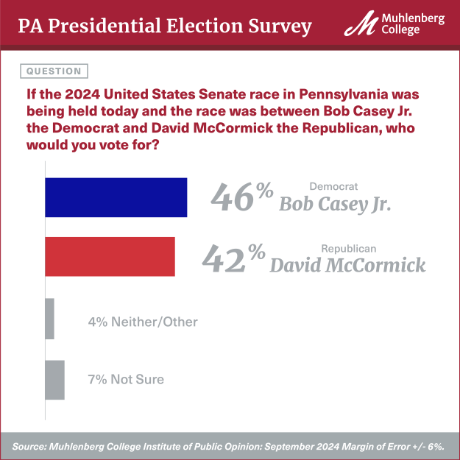
- In the U.S. Senate race in the Commonwealth three-term Democratic incumbent Bob Casey Jr. holds a 5 point lead over his Republican challenger Dave McCormick.
- Both Casey and McCormick have seen their favorability ratings decline since the last MCIPO poll in April, with the intensive negative campaign ads permeating the state likely impacting voter images of these candidates.
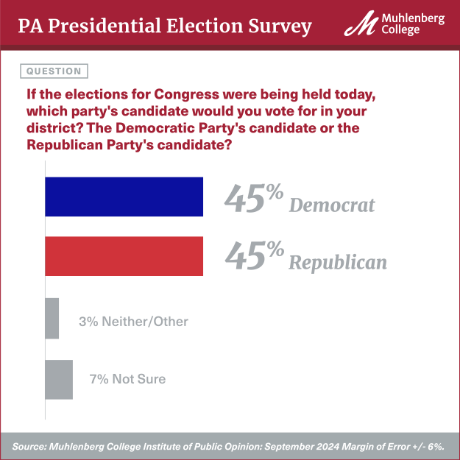
- Pennsylvania voters are evenly divided in terms of their party preferences within their congressional districts, with 45% intending to vote for a Democrat in the upcoming election and 45% planning to vote Republican in their U.S. House race.
- Among the issues voters consider relevant in deciding their vote in the 2024 presidential election the economy/inflation stands out, with 35% of respondents citing this as the most important issue. Economic concerns are followed in importance by abortion/reproductive rights, cited by 13% of respondents, with immigration and border concerns rounding out the top 3 self-identified most important issues of this presidential contest at 11%.
- Political party plays a substantial role in issue importance. Among registered Democrats, 25% cite abortion/reproductive rights as their priority issue, compared to only 3% of registered Republicans. Registered Democrats also highlight the economy/inflation, with 18% identifying it as a priority issue area. This pales in comparison to registered Republicans however, 55% of whom cite the economy as most important in determining their presidential vote. This is followed by immigration, cited by 21% of registered Republicans as a top priority issue, as compared to only 2% of registered Democrats. Notably, 11% of registered Democrats cite the protection of democracy/democratic norms as their most important issue, compared to only 2% of registered Republicans.
- As the election season unfolds in Pennsylvania the state’s voters continue to give Governor Josh Shapiro high marks for his performance in office with just under 6 in 10 voters (59%) approving of the first term Democrat’s work as the Commonwealth’s Chief Executive.
- There is a wide partisan gap in confidence among voters regarding mail votes in Pennsylvania being accurately cast and counted, with 61% of Democrats “very confident” in this voting method, compared to only 8% of Republicans.
Methodological Statement:
The following report contains the results of a telephone survey of (450) likely voters in the Commonwealth of Pennsylvania between September 16 and 19, 2024. Respondents were interviewed in English on both landlines (111) and cell phones (339). With a randomly selected sample of respondents the margin of error for the surveys is +/- 6% at a 95% level of confidence. Margins of error for questions with smaller sample size will be larger. In addition to sampling error, one should consider that question wording and other fielding issues can introduce error or bias into survey results. Interviewing was conducted by Communication Concepts of Easton, Pennsylvania under protocols established by the MCIPO. The data has been weighted to gender, age, region, party, race and educational attainment to reflect voter population parameters. The calculation of sampling error takes into account design effects due to the weighting identified above. In order to reach a representative sample of registered voters both land lines and cell phones were called up to 3 times. The sampling frame for the study is from the registered voters files of the Commonwealth of Pennsylvania. To determine likely voters, only voters who have voted in 1 or more of the last 4 general elections (2020-2023), or who is a new registrant since November of 2020 were included in the sampling frame. In addition, only survey respondents from this frame who indicated that they were “definitely” or “very likely” to vote in the November election were included in the sample. Due to rounding the totals provided in the frequency report may not total 100%. The survey instrument (presented in its entirety below) was designed by Dr. Christopher P. Borick and Dr. Lindsay Burt of the MCIPO. The survey was funded exclusively by the Morning Call and the MCIPO. For more detailed information on the methods employed please contact the MCIPO at 484-664-3444 or email Dr. Borick at cborick@muhlenberg.edu
INSTRUMENT and FREQUENCIES
Muhlenberg College Institute of Public Opinion
September 2024 PA Election Poll
Q1: Thank you. Which of the following categories best describes your current voting status? Are you registered as a ______? (READ LIST)
1. Democrat…………………………..45%
2. Republican ……………………….44%
3. Independent ………………………. 9%
4. Other Party ………………………..3%
5. Not Registered to Vote in Pennsylvania (END SURVEY)
98. Not Sure (Volunteered) (END SURVEY)
99. Refused (Volunteered) (END SURVEY)
Q2: How likely are you to vote in the November 2024 presidential election? Are you definitely going to vote, very likely to vote, not too likely to vote or definitely not voting?
1. Definitely Voting………………….91%
2. Very Likely to Vote………………. 9%
3. Not Too Likely to Vote (TERMINATE)
4. Definitely Not Voting (TERMINATE)
5. Unsure (VOLUNTEERED/TERMINATE)
Q3: Now, I would like to ask your overall impression of a few political figures. For each name I read, please tell me if your impression of him or her is favorable or unfavorable. (ROTATE)
First, Kamala Harris
1. Favorable…………………………..47%
2. Unfavorable ……………………..50%
3. Neutral/Not Sure………………. 3%
Q4: Next, Donald Trump
1. Favorable…………………………….45%
2. Unfavorable……………………….52%
3. Neutral/Not Sure………………. 3%
|
|
December 2023 |
April 2024 |
September 2024 |
|
Favorable |
33% |
39% |
45% |
|
Unfavorable |
56% |
55% |
52% |
|
Neutral/Not Sure |
11% |
6% |
3% |
|
Haven't heard of Him |
0% |
0% |
0% |
Q5: Bob Casey Jr.
1. Favorable……………………………......33%
2. Unfavorable ………………………….38%
3. Neutral/Not Sure……………………. 23%
4. Haven't Heard of Him……………….. 6%
|
|
April 2024 |
September 2024 |
|
Favorable |
39% |
33% |
|
Unfavorable |
33% |
38% |
|
Neutral/Not Sure |
20% |
23% |
|
Haven't heard of Him |
8% |
6% |
Q6: David McCormick
1. Favorable………………………………28%
2. Unfavorable……………………………38%
3. Neutral/Not Sure…………………… 24%
4. Haven't Heard of Him………………….10%
|
|
April 2024 |
September 2024 |
|
Favorable |
28% |
28% |
|
Unfavorable |
26% |
38% |
|
Neutral/Not Sure |
29% |
24% |
|
Haven't heard of Him |
17% |
10% |
Q7: Next, do you approve or disapprove of the way Joe Biden is handling his job as President?
1. Approve………………………………..36%
2. Disapprove……………………………. 58%
3. No opinion (Volunteered)…………….. 5%
|
|
December 2023 |
April 2024 |
September 2024 |
|
Approve |
34% |
35% |
36% |
|
Disapprove |
57% |
61% |
58% |
|
No Opinion |
9% |
5% |
5% |
Q8: Do you approve or disapprove of the way Josh Shapiro is handling his job as Governor of Pennsylvania?
1. Approve………………………………… 59%
2. Disapprove …………………………….. 27%
3. No opinion (Volunteered) …………14%
|
|
December 2023 |
April 2024 |
September 2024 |
|
Approve |
51% |
64% |
59% |
|
Disapprove |
21% |
19% |
27% |
|
No Opinion |
28% |
17% |
14% |
Q9: Now, if the 2024 presidential election was being held today and the race was between Donald Trump and Kamala Harris who would you vote for? (OPTIONS ROTATED)
1. Trump (Skip to Q 11)……………………………….......47%
2. Harris (Skip to Q11)……………………………….........47%
3. Neither/Other (Volunteered) (Skip to Q11) …….4%
98. Not Sure (Volunteered)……………………………........2%
Q10: Are you leaning more toward voting for Donald Trump or Kamala Harris? (OPTIONS ROTATED) (ASKED ONLY OF THOSE THAT SAID, “NOT SURE” ON Q9) (n = 10)
1. Trump……………………………. .........53%
2. Harris……………………………..... 20%
98. Not Sure (Volunteered)………… 28%
PRESIDENTIAL RACE WITH LEANERS
TRUMP……………………48%
HARRIS…………………...48%
NEITHER/OTHER……….. 4%
NOT SURE……………….. 1%
Q11: Next, if the 2024 United States Senate race in Pennsylvania was being held today and the race was between Bob Casey Jr. the Democrat and David McCormick the Republican, who would you vote for.
1. Casey…………………………………46%
2. McCormick…………………………..42%
3. Neither/Other (Volunteered)……….. 4%
98. Not Sure (Volunteered)……………… 7%
|
|
April 2024 |
September 2024 |
|
Casey |
45% |
46% |
|
McCormick |
41% |
42% |
|
Neither/Other |
5% |
4% |
|
Not Sure |
7% |
7% |
Q12: Are you leaning more toward voting for Bob Casey Jr. or David McCormick? (OPTIONS ROTATED) (ASKED ONLY OF THOSE THAT SAID, “NOT SURE” ON Q11) (n = 17)
1. Casey………………………………. 27%
2. McCormick………………………… 7%
3. Neither/Other (Volunteered)……… 16%
98. Not Sure (Volunteered)…………….. 50%
SENATE RACE WITH LEANERS
CASEY…………………….. 48%
MCCORMICK…………….. 43%
NEITHER/OTHER………… 5%
NOT SURE………………… 4%
Q13: If the elections for Congress were being held today, which party's candidate would you vote for in your district? The Democratic Party's candidate or the Republican Party's candidate? (OPTIONS ROTATED)
1. Democrat……………………….. 45%
2. Republican………………………45%
3. Neither/Other (Volunteered)…… 3%
98. Not Sure (Volunteered)……….. 7%
|
|
December 2023 |
April 2024 |
September 2024 |
|
Democrat |
42% |
45% |
45% |
|
Republican |
41% |
44% |
45% |
|
Neither/Other |
16% |
5% |
3% |
|
Not Sure |
1% |
7% |
7% |
Q14: What is the most important issue for you in terms of deciding your vote in the 2024 presidential election? (Open Ended) (Coded Into Categories)
Economy/Inflation……………………………… 35%
Abortion/Reproductive Rights………………… 13%
Immigration……………………………………..... 11%
Democracy/Democratic Norms………………… 7%
Character of Candidate…………………………. 4%
Health Care……………………………………....... 3%
Foreign Policy/National Security……………… 2%
International Conflicts………………………….. 2%
Climate Change…………………………………..... 2%
Violent Crime…………………………………… ...... 1%
Gun Control…………………………………….. ..... 1%
Inequality………………………………………..... < 1%
Supreme Court………………………………….. < 1%
Not Sure…………………………………………....... 3%
Other……………………………………………. ....... 17%
Q15: How important is it for the U.S. to take an active role in world affairs? Would you say it is: (READ LIST)
1. Extremely Important…………………34%
2. Very Important……………………...… 36%
3. Somewhat Important………………... 19%
4. Not Too Important…………………...... 4%
5. Not at All Important………………....… 5%
98. Not Sure (Volunteered)……………... 1%
Q16: Which of the following statements best matches your view in terms of the foreign policy of the United States? (READ OPTIONS)
1. In foreign policy, the U.S. should take into account the interests of its allies even if it means making compromises with them…………………..46%
2. In foreign policy, the U.S. should follow its own national interests even when its allies strongly disagree……………………………... 39%
3. Neither (Volunteered)…………………………………… 4%
98. Not Sure (Volunteered)…………………………………..11%
How confident are you that, across the country, votes cast in the following methods will be accurately cast and counted in this November’s elections.? First: (ROTATE OPTIONS)
|
Very Confident |
Somewhat Confident |
Not Too Confident |
Not at all Confident |
Not Sure |
|
|
Q17: Paper Ballots |
51% |
21% |
11% |
12% |
5% |
|
Q18: Electronic Voting systems |
47% |
21% |
13% |
14% |
5% |
|
Q19: Mail ballots |
35% |
19% |
14% |
29% |
3% |
Q20: Which of the following do you think is the biggest threat to Pennsylvania having a safe, secure and accurate election in 2024? (ROTATE OPTIONS)
1. Foreign interference in the election…………..13%
2. Voting machines malfunctioning………………. 6%
3. Voter fraud……………………………………..........…32%
4. The use of mail ballots ………………………....….13%
5. Suppression of individuals from voting………24%
6. Other factor (Volunteered)…………………….... 5%
98. Not Sure (Volunteered)………………………....… 8%
Q21: Finally, I have a few questions about yourself. Which of the following categories best describes your racial identity? Are you (READ LIST)?
1. White/Caucasian………………...74%
2. Black/African-American……… 10%
3. Hispanic/Latino………………... 6%
4. Asian…………………………........ 3%
5. Native American……………..… 1%
6. Mixed race…………………….... 4%
7. or other………………………....... 2%
98. Not Sure (Volunteered)..... <1%
Q22: Which of the following categories best describes your religious affiliation? Are you (READ LIST)?
1. Catholic…………………………….........….30%
2. Protestant……………………………......... 29%
3. Jewish………………………………........... 3%
4. Muslim………………………………........... <1%
5. Hindu…………………………………............ 1%
6. Other Religion (Including agnostic).... 28%
7. or Atheist ……………………………........... 5%
98. Not Sure (Volunteered)................ 5%
Q23: What is your highest level of education? (READ LIST)
1. Less than High School……………....…. 2%
2. High School Graduate………………....... 30%
3. Some college or technical school….. 29%
4. College graduate (4 yr only)........... 23%
5. Graduate or professional degree…… 16%
Q24: In the 2020 Presidential election did you vote for:
1. Donald Trump……………………………………………43%
2. Joe Biden………………………………………………....46%
3. Another Candidate………………………………………. 3%
4. Or did you not vote in the 2016 presidential election……. 7%
98. Not Sure (Volunteered)............................................ 1%
Q25: Which of the following categories best describes your family income? Is it (READ LIST)?
1. Under $20,000………………7%
2. $20,000-$40,000……………17%
3. $40,000-$60,000……………15%
4. $60,000-$80,000……………15%
5. $80,000-$100,000…………..12%
6. Over $100,000………………30%
98: Not Sure (Volunteered)…… 4%
Q26: In which of the following age categories does your current age fall. READ LIST _______
1. 18-29……………..16%
2. 30-49……………..28%
3. 50-65……………..28%
4. or Over 65………..29%
Q27: Finally, to which gender identity do you most identify? (READ LIST)
1. Male………………………………………………..48%
2. Female………………………………………….…..51%
3. Or another category besides Male or Female……… 1%
Q28: Thank you. Would you be open to commenting on the issues in this survey and be interested in being contacted by a reporter?
1. Yes…………..33%
2. No……………67%
Selected Crosstabs
Trump vs. Harris
(Including Leaners)
|
|
Trump |
Harris |
Neither/Other |
Not Sure |
|
Overall |
48% |
48% |
4% |
<1% |
|
Male |
59% |
36% |
4% |
1% |
|
Female |
38% |
59% |
3% |
0% |
|
White |
54% |
42% |
3% |
1% |
|
Person of Color |
27% |
66% |
5% |
1% |
|
No 4 Year Degree |
58% |
37% |
5% |
<1% |
|
4 Year Degree |
33% |
65% |
2% |
1% |
|
18-29 |
35% |
61% |
4% |
0% |
|
30-49 |
53% |
44% |
3% |
0% |
|
50-65 |
59% |
37% |
2% |
1% |
|
Over 65 |
42% |
53% |
4% |
1% |
|
Biden 2020 |
6% |
92% |
1% |
1% |
|
Trump 2020 |
97% |
2% |
1% |
0% |
|
Democrat |
5% |
93% |
2% |
1% |
|
Republican |
95% |
4% |
2% |
1% |
|
Independent |
40% |
45% |
16% |
0% |
|
“Definitely Voting” |
48% |
49% |
3% |
<1% |
|
“Very Likely to Vote” |
50% |
33% |
15% |
3% |
|
Catholic |
46% |
46% |
6% |
2% |
|
Protestant |
61% |
38% |
1% |
0% |
|
Non-Christian/No Religion |
40% |
56% |
4% |
1% |
Casey vs. McCormick
(Including Leaners)
|
|
Casey |
McCormick |
Neither/Other |
Not Sure |
|
Overall |
48% |
43% |
5% |
4% |
|
Male |
38% |
53% |
5% |
4% |
|
Female |
57% |
34% |
5% |
5% |
|
White |
44% |
47% |
5% |
4% |
|
Person of Color |
59% |
28% |
8% |
4% |
|
No 4 Year Degree |
37% |
52% |
7% |
4% |
|
4 Year Degree |
63% |
29% |
3% |
5% |
|
18-29 |
59% |
35% |
1% |
4% |
|
30-49 |
47% |
45% |
7% |
1% |
|
50-65 |
36% |
51% |
6% |
8% |
|
Over 65 |
53% |
38% |
5% |
4% |
|
Biden 2020 |
89% |
4% |
3% |
3% |
|
Trump 2020 |
4% |
87% |
4% |
5% |
|
Democrat |
89% |
5% |
2% |
5% |
|
Republican |
6% |
84% |
6% |
5% |
|
Independent |
54% |
33% |
13% |
0% |
|
“Definitely Voting” |
48% |
43% |
5% |
4% |
|
“Very Likely to Vote” |
38% |
45% |
12% |
5% |
|
Catholic |
46% |
42% |
6% |
6% |
|
Protestant |
39% |
57% |
2% |
2% |
|
Non-Christian/No Religion |
56% |
34% |
7% |
4% |
Congress: Democrat vs. Republican
|
|
Democrat |
Republican |
Neither/Other |
Not Sure |
|
Overall |
45% |
45% |
3% |
7% |
|
Male |
34% |
54% |
5% |
8% |
|
Female |
57% |
36% |
2% |
6% |
|
White |
40% |
50% |
2% |
7% |
|
Person of Color |
63% |
26% |
6% |
5% |
|
No 4 Year Degree |
36% |
54% |
3% |
7% |
|
4 Year Degree |
60% |
30% |
4% |
6% |
|
18-29 |
58% |
29% |
9% |
4% |
|
30-49 |
42% |
50% |
4% |
4% |
|
50-65 |
36% |
54% |
0% |
10% |
|
Over 65 |
50% |
40% |
3% |
8% |
|
Biden 2020 |
85% |
6% |
2% |
7% |
|
Trump 2020 |
3% |
92% |
1% |
4% |
|
Democrat |
91% |
3% |
2% |
5% |
|
Republican |
2% |
98% |
1% |
6% |
|
Independent |
39% |
26% |
13% |
23% |
|
“Definitely Voting” |
46% |
45% |
3% |
6% |
|
“Very Likely to Vote” |
42% |
39% |
7% |
12% |
|
Catholic |
47% |
43% |
4% |
7% |
|
Protestant |
33% |
60% |
2% |
5% |
|
Non-Christian/No Religion |
53% |
34% |
4% |
9% |
Confidence in mail ballots being accurately cast and counted
|
|
Very Confident |
Somewhat Confident |
Not very Confident |
Not Confident at All |
Not Sure |
|
Overall |
36% |
18% |
14% |
30% |
3% |
|
Male |
30% |
15% |
16% |
36% |
3% |
|
Female |
40% |
22% |
13% |
22% |
3% |
|
White |
37% |
17% |
15% |
29% |
3% |
|
Person of Color |
34% |
26% |
13% |
26% |
2% |
|
No 4 Year Degree |
27% |
15% |
15% |
39% |
5% |
|
4 Year Degree |
48% |
24% |
13% |
15% |
0% |
|
18-29 |
44% |
17% |
17% |
16% |
7% |
|
30-49 |
33% |
16% |
12% |
37% |
2% |
|
50-65 |
28% |
17% |
14% |
41% |
1% |
|
Over 65 |
41% |
21% |
15% |
20% |
4% |
|
Biden 2020 |
66% |
20% |
8% |
5% |
1% |
|
Trump 2020 |
5% |
14% |
19% |
58% |
4% |
|
Democrat |
61% |
23% |
10% |
5% |
2% |
|
Republican |
8% |
14% |
19% |
55% |
5% |
|
Independent |
46% |
21% |
10% |
23% |
0% |
|
“Definitely Voting” |
37% |
18% |
14% |
29% |
3% |
|
“Very Likely to Vote” |
22% |
29% |
17% |
29% |
2% |
|
Catholic |
37% |
19% |
13% |
29% |
2% |
|
Protestant |
27% |
23% |
17% |
32% |
1% |
|
Non-Christian/No Religion |
39% |
14% |
14% |
28% |
5% |
Which of the following do you think is the biggest threat to Pennsylvania having a safe, secure and accurate election in 2024?
|
|
Foreign interference in the election
|
Voting machines malfunctioning
|
Voter fraud
|
The use of mail ballots
|
Suppression of individuals from voting
|
Other Factor |
Not Sure |
|
Male |
13% |
6% |
32% |
19% |
21% |
6% |
5% |
|
Female |
14% |
6% |
32% |
7% |
26% |
4% |
10% |
|
White |
14% |
6% |
33% |
12% |
24% |
5% |
6% |
|
Person of Color |
13% |
6% |
29% |
11% |
25% |
5% |
11% |
|
No 4 Year Degree |
12% |
6% |
41% |
14% |
13% |
6% |
9% |
|
4 Year Degree |
16% |
6% |
20% |
11% |
39% |
4% |
5% |
|
18-29 |
15% |
7% |
33% |
6% |
32% |
6% |
1% |
|
30-49 |
12% |
4% |
33% |
11% |
29% |
5% |
6% |
|
50-65 |
13% |
8% |
35% |
15% |
18% |
4% |
7% |
|
Over 65 |
14% |
5% |
28% |
15% |
19% |
6% |
13% |
|
Biden 2020 |
22% |
4% |
11% |
5% |
43% |
6% |
9% |
|
Trump 2020 |
5% |
7% |
51% |
23% |
3% |
5% |
7% |
|
Democrat |
21% |
5% |
13% |
6% |
44% |
6% |
6% |
|
Republican |
7% |
7% |
53% |
19% |
4% |
4% |
7% |
|
Independent |
13% |
5% |
24% |
13% |
24% |
8% |
13% |
|
“Definitely Voting” |
14% |
6% |
32% |
13% |
23% |
5% |
7% |
|
“Very Likely to Vote” |
10% |
8% |
30% |
13% |
28% |
3% |
10% |
|
Catholic |
19% |
7% |
31% |
12% |
18% |
4% |
10% |
|
Protestant |
11% |
6% |
37% |
14% |
20% |
6% |
6% |
|
Non-Christian/No Religion |
11% |
6% |
31% |
13% |
30% |
6% |
4% |
TIME SERIES FOR ELECTION PROCESS QUESTIONS
Confidence in Voting Methods
|
|
Very Confident |
Somewhat Confident |
Not Too Confident |
Not Confident At All |
||||||||
|
|
2021 |
APR 2024 |
Sept 2024 |
2021 |
APR 2024 |
Sept 2024 |
2021 |
APR 2024 |
Sept 2024 |
2021 |
APR 2024 |
Sept 2024 |
|
Paper Ballots |
36% |
36% |
51% |
29% |
37% |
21% |
15% |
15% |
11% |
18% |
11% |
12% |
|
Electronic Voting systems |
37% |
51% |
47% |
32% |
33% |
21% |
14% |
9% |
13% |
17% |
8% |
14% |
|
Mail ballots |
29% |
29% |
35% |
21% |
28% |
19% |
13% |
21% |
14% |
37% |
22% |
29% |
Biggest Threat to Integrity of Next Election
|
|
FEBRUARY 2020 |
AUGUST 2020 |
OCTOBER 2020 |
DECEMBER 2020
|
DECEMBER 2021
|
APRIL 2024 |
SEPT 2024 |
|
Foreign interference in the election |
17% |
14% |
8% |
5% |
8% |
13% |
13% |
|
Voting machines malfunctioning |
22% |
7% |
3% |
5% |
6% |
7% |
6% |
|
Voter fraud |
25% |
39% |
40% |
33% |
24% |
25% |
32% |
|
The Use of Mail Ballots |
NA |
NA |
NA |
NA |
19% |
19% |
12% |
|
Suppression of individuals from voting |
21% |
30% |
34% |
30% |
35% |
32% |
24% |
|
Other Factor (Vol) |
15% |
4% |
5% |
13% |
5% |
3% |
5% |
|
Not Sure |
1% |
7% |
11% |
15% |
4% |
1% |
7% |
Note: “The Use of Mail Ballots” was not included in survey waves before 2021