Muhlenberg College Pennsylvania 2020 Post-Election Poll: January 2021
Survey Overview
The following report and findings are drawn from a survey of 406 Pennsylvanians who participated in the 2020 general election. The survey was fielded by phone in December of 2020, about one month after the election took place.
PDF - Muhlenberg College Pennsylvania 2020 Post-Election Poll: January 2021
Key Findings
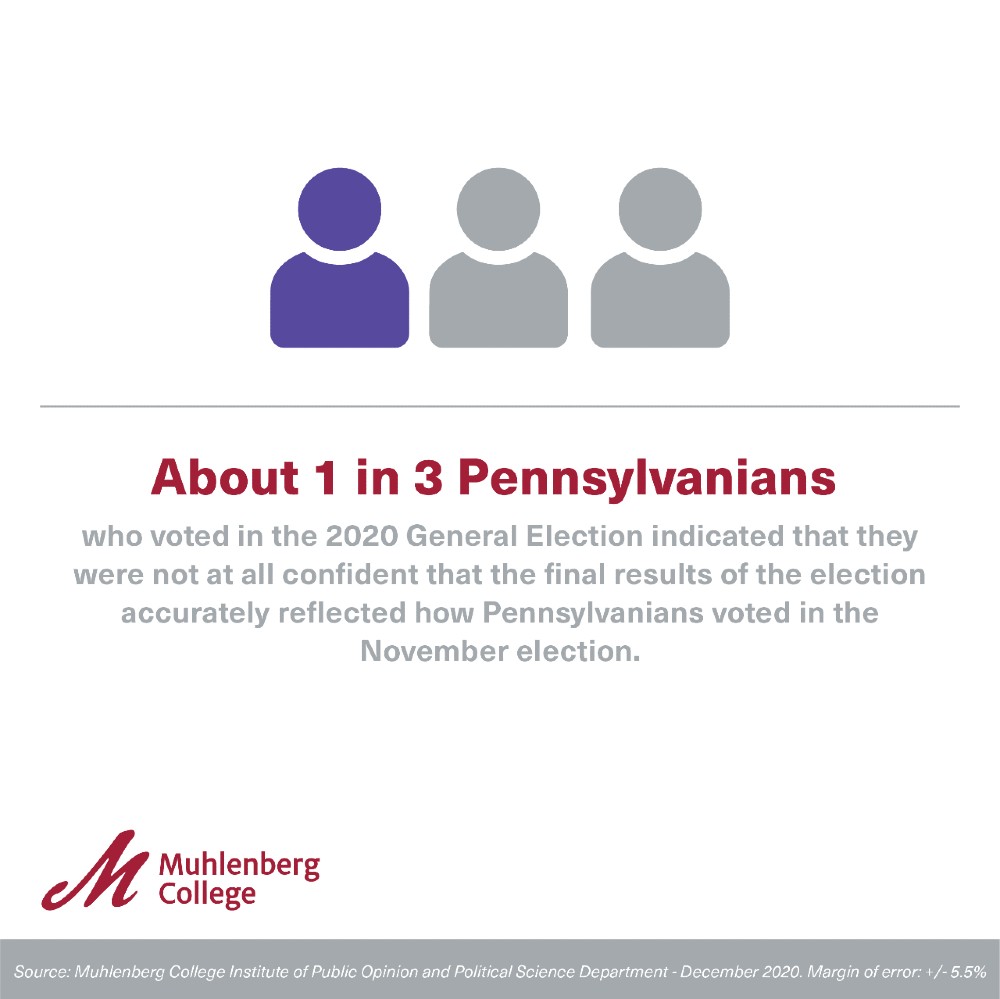
- About 1 in 3 Pennsylvanians who voted in the 2020 general election indicated that they were not at all confident that the final results of the election accurately reflected how Pennsylvanians voted in the November election.
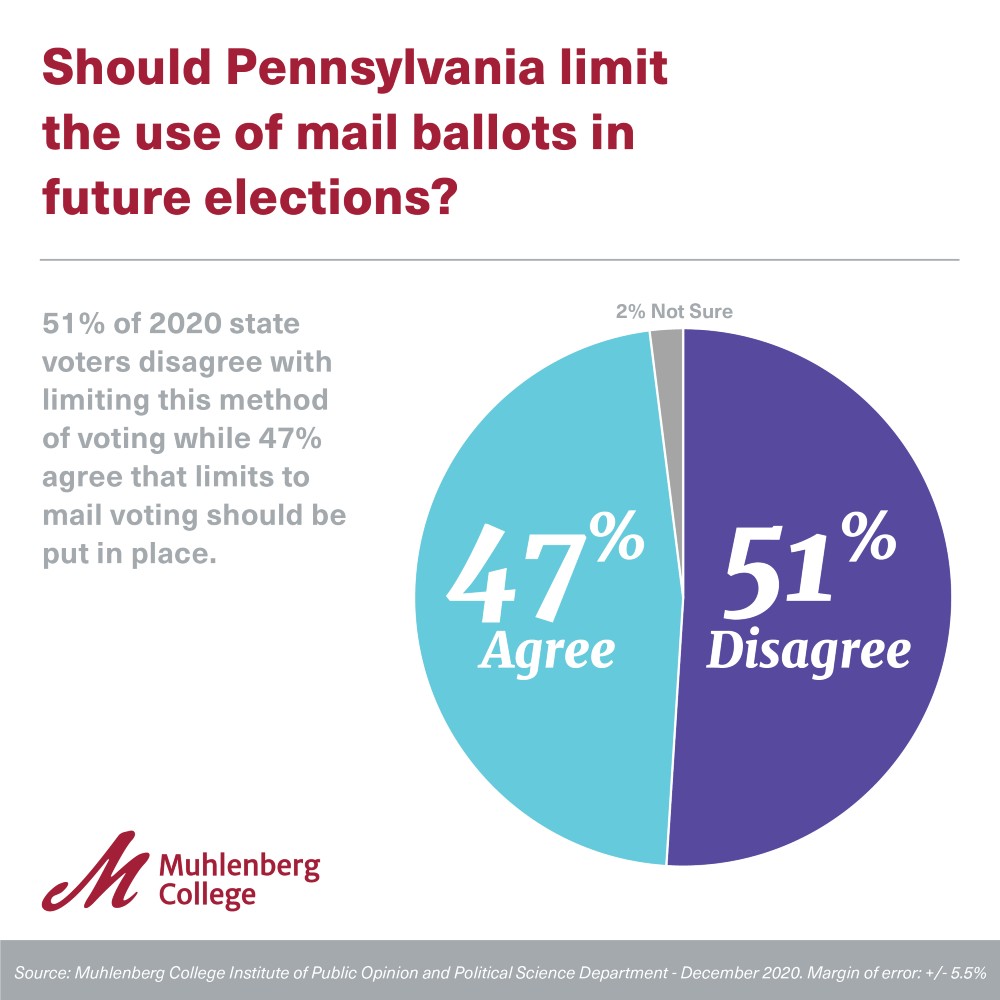
- 2020 voters in the Keystone State are highly divided on potential limiting of the use of mail ballots in future elections, with 51% disagreeing with limiting this method of voting, and 47% agreeing that limits to mail voting should be put in place.
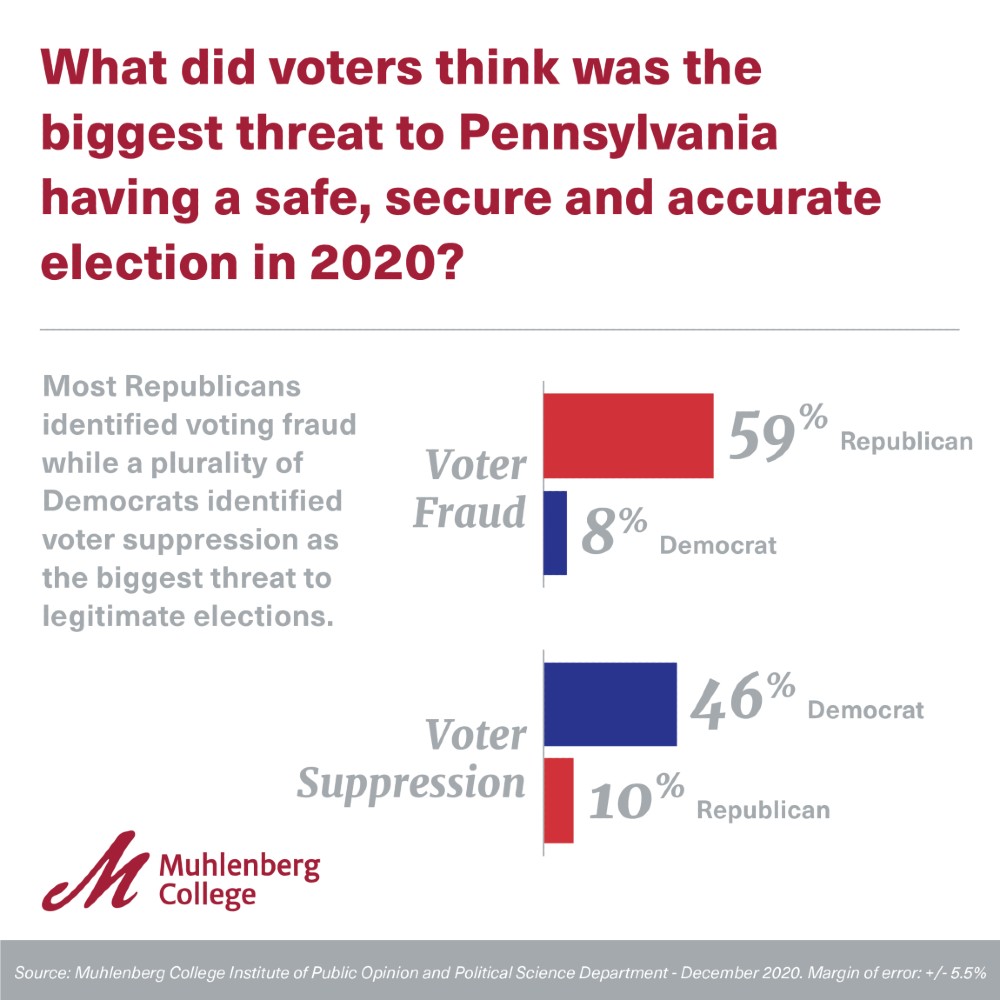
- While most Republicans (59%) identified voting fraud as the biggest threat to Pennsylvania having a safe, secure and accurate election in 2020, a plurality of Democrats (46%) identified voter suppression as the biggest threat to legitimate elections.
- A majority (53%) of 2020 Pennsylvania voters indicated that they distrust President Trump, with almost half (47%) of the November electorate strongly distrusting the nation’s 45th President.
- Men were more likely to vote in person compared to women, with 73% of men and 57% of women reporting that they voted in person on Election Day.
- Mail-in voters expressed significantly greater confidence in both overall electoral fairness and confidence in the final results of the election. Whereas 84% of in-person voters said they were somewhat or very confident in the final results of the PA election, just over 40% of in-person voters said the same.
- More than 87% of mail-in voters said they were somewhat or very confident that elections in PA were conducted in a fair way; only about 22% of in-person voters expressed similar confidence. In-person voters expressed less confidence in the results of the election, less confidence in county election officials, greater concern that there was widespread fraud, and less support for the use of mail-in ballots in the future.
- Notably, there are fewer reported differences between mail-in and in-person voters when it comes to respondents’ perceptions about inaccurate counting of ballots. About 48% of in-person voters and 39% of mail-in voters somewhat or strongly agreed that not counting legitimate ballots was a significant problem in the 2020 elections.
- As expected, gender played a major role in the 2002 elections in Pennsylvania, with men reporting higher favorability ratings for Trump and the Republican Party, while women reported higher favorability toward Biden and the Democratic Party.
- Pennsylvania voters were strongly divided on an array of election related matters, with the highest percentages of responses to the survey questions being found at one or the other extreme. This was especially true in regard to the questions about whether social media outlets violate First Amendment rights, and whether Donald Trump weakened the legitimacy of the electoral process during his term in office.
- About 2 in 3 voters strongly believe that the spread of fake news and misinformation on the internet is a serious threat to democracy.
- A slight majority of voters without a 4 year degree believe that election fraud was less of an issue than legitimate ballots not being counted, while only 38% of voters with a 4 year degree believe the same.
- There is a slight, but statistically significant, difference between the view of misinformation on the internet between voters with bachelor degrees and those without. 90% of those without bachelor degrees believe misinformation via the internet is a threat to our democracy, while 85% of those with a bachelor degree maintain the same position. Only 6% of voters without a bachelor degree disagree with the premise that misinformation is a serious threat, while 12% of those with a bachelor degree believe the same.
- A slight minority (44%) of voters with a bachelor degree believe that social media companies violate a user’s First Amendment rights when they ban users, while a majority (56%) of voters without a bachelor degree agree.
- Confidence in the result of the election was greatly different with respect to educational backgrounds. A majority of voters with a bachelor's degree (72%) were confident that the results of the election were accurate, while a majority of voters without a degree were (51%) not confident in the accuracy of the results.
- A majority of 2020 voters with a 4 year degree (64%) believe that President Trump weakened the legitimacy of the electoral process during his term in office, while only 37% of voters without a bachelor degree agree.
- Despite its recent prominence across the United States, the Black Lives Matter Movement remains a highly partisan issue in Pennsylvania. 81% of Democrat respondents held a favorable opinion concerning the movement, while 71% of Republicans had an unfavorable opinion. Also worth noting is that among independent voters, 54% favored BLM to some degree, while only 25% viewed it unfavorably.
- While there are some partisan divisions in regards to trust in the U.S. Supreme Court, perceptions of this institution are less partisan in relation to other issues and institutions. A majority of Democrats, Republicans and independent voters trust (either strongly or somewhat) the SCOTUS.
- Despite the fact that the court systems have become more more politicized in recent years, a majority of Democrats. Republicans, and Independents still trust the highest court in Pennsylvania. However, Republicans are significantly more likely to distrust the court.
- A Majority of Republicans (68%) do not have any confidence in the accuracy of the election while 82% of Democrats and 56% of Independents are very confident the results were accurate.
Methodological Statement
The following report contains the results of a telephone survey of (406) 2020 general election voters in the Commonwealth of Pennsylvania between December 8 and 16, 2020. Respondents were interviewed in English on both landlines (113) and cell phones (293). With a randomly selected sample of respondents the margin of error for the surveys is +/- 5.5% at a 95% level of confidence. Margins of error for questions with smaller sample size will be larger. In addition to sampling error, one should consider that question wording and other fielding issues can introduce error or bias into survey results. Interviewing was conducted by Communication Concepts of Easton, Pennsylvania under protocols established by the Muhlenberg College Institute of Public Opinion (MCIPO). The data has been weighted to gender, age, party registration, race, educational attainment and 20202 general election voting results to reflect voter population parameters. The calculation of sampling error takes into account design effects due to the weighting identified above. In order to reach a representative sample of registered voters both landlines and cell phones were called up to 3 times. The sampling frame for the study is from the registered voters files of the Commonwealth of Pennsylvania. Only voters who indicated that they voted in the 2020 election were included in the sample. Due to rounding the totals provided in the frequency report may not total 100%. The survey instrument (presented in its entirety below) was designed by members of the Muhlenberg College Pennsylvania Post-Election Poll Project (PPEPP), which is a partnership of the Political Science Department of Muhlenberg College and the MCIPO. The survey was funded by Muhlenberg College and a grant from the Mellon Foundation. For more detailed information on the methods employed, please contact the MCIPO at 484-664-3444 or email Christopher Borick, director of the MCIPO, at [email protected].
2020 PENNSYLVANIA POST-ELECTION SURVEY
INSTRUMENT and FREQUENCY REPORT
Q1: Thank you. Which of the following categories best describes your current voting registration status? Are you registered as a: (READ LIST)
- Democrat………………………….. 45%
- Republican………………………... 44%
- Independent………………………. 9%
- Other Party………………………… 3%
- Not Registered to Vote in Pennsylvania (END SURVEY)
- Not Sure (Volunteered) (END SURVEY)
Next, we have a few questions about your level of confidence in the 2020 electoral process in Pennsylvania. For each aspect of the election process that I mention, tell me if you are very confident, somewhat confident, not too confident or not confident at all with the aspect mentioned. First how confident are you: (ROTATE OPTIONS)
|
Very Confident |
Somewhat Confident |
Not Too Confident |
Not Confident At All |
Not Sure |
||
Q2: That the final results of the election accurately reflected how Pennsylvanians voted. |
||||||
|
49% |
8% |
6% |
34% |
3% |
||
|
Q3: That elections in Pennsylvania were conducted in a fair way. |
49% |
11% |
9% |
31% |
1% |
|
|
Q4 : That Joe Biden received the most votes in the presidential election in Pennsylvania. |
52% |
7% |
9% |
30% |
3% |
|
|
Q5: That there was widespread election fraud in the 2020 Presidential Election in Pennsylvania. |
31% |
10% |
7% |
50% |
2% |
|
Next, I have some questions regarding your level of trust with some officials and institutions in the United States. For each institution and official please indicate if you strongly trust, somewhat trust, somewhat distrust, or strongly distrust the institution or individual. First: (ROTATE OPTIONS)
|
Strongly Trust |
Somewhat Trust |
Somewhat Distrust |
Strongly Distrust |
Not Sure |
||
Q6: President Trump |
||||||
|
35% |
12% |
6% |
47% |
<1% |
||
|
Q7: Governor Wolf |
24% |
28% |
8% |
31% |
9% |
|
|
Q8: County Election Officials |
30% |
34% |
6% |
8% |
23% |
|
|
Q9: The U.S. Supreme Court |
28% |
41% |
13% |
5% |
14% |
|
|
Q10: The Pennsylvania Supreme Court |
19% |
36% |
9% |
14% |
24% |
|
Next, for the following list of people and things that I mention, please let me know if you have a very favorable, somewhat favorable, somewhat unfavorable or very unfavorable opinion of the person or thing I mention. First: (ROTATE OPTIONS)
|
Very Favorable |
Somewhat Favorable |
Somewhat Unfavorable |
Very |
Not Sure |
||
|
Q11: The Black Lives Matter Movement |
||||||
|
31% |
20% |
9% |
31% |
10% |
||
|
Q12: The Democratic Party |
22% |
27% |
11% |
35% |
5% |
|
|
Q13: The Republican Party |
22% |
26% |
16% |
32% |
4% |
|
|
Q14: Donald Trump |
34% |
10% |
7% |
48% |
1% |
|
|
Q15: Joe Biden |
29% |
23% |
8% |
36% |
3% |
|
Q16. Which of the following do you think was the biggest threat to Pennsylvania having a safe, secure and accurate election in 2020? (ROTATE OPTIONS)
- Foreign interference in the election………....5%
- Voting machines malfunctioning…………......5%
- Voter fraud……………………………………............33%
- Suppression of individuals from voting…… 30%
- Other factor (Volunteered)…………………......13%
- Not Sure……………………………………...............15%
Next I’m going to read you a few statements. For each statement I read tell me if you strongly agree, somewhat agree, somewhat disagree or strongly disagree with the statement: First:
|
|
Strongly Agree |
Somewhat Agree |
Somewhat Disagree |
Strongly Disagree |
Not Sure |
|
Q17: Most media platforms treated President Trump fairly throughout his term. |
18% |
27% |
10% |
41% |
4% |
|
Q18: Pennsylvania should limit the use of mail ballots in future elections. |
38% |
9% |
11% |
40% |
2% |
|
Q19: Social media companies violate users’ First Amendment rights when they ban users based on the content of their posts. |
29% |
22% |
13% |
20% |
16% |
|
Q20: The spread of fake news and misinformation on the internet is a serious threat to our democracy. |
68% |
19% |
5% |
4% |
4% |
|
Q21: President Trump weakened the legitimacy of the electoral process during his term in office. |
34% |
14% |
10% |
34% |
9% |
|
Q22: Not counting legitimate ballots was more of a problem in 2020 in Pennsylvania than any election fraud. |
23% |
22% |
12% |
18% |
25% |
Q23: In the 2020 election did you vote in person at a polling station, or vote by mail?
- Vote in Person……..65%
- Vote by Mail…………35%
Q24: Which of the following best describes your activity in the 2020 Presidential Election? Did you vote for:
- Donald Trump……………….49%
- Joe Biden………………………50%
- Some other candidate……2%
Q25: Finally, I have a few questions about yourself. Which of the following categories best describes your racial identity? Are you (READ LIST)?
- White/Caucasian…….80%
- African-American……10%
- Hispanic ………………....4%
- Latino……………………....1%
- Asian…………………….....1%
- Native American ……<1%
- Mixed race………………. 2%
- or other ………………… 1%
Q26: Which of the following categories best describes your religious affiliation? Are you (READ LIST)?
- Catholic ………………………….26%
- Protestant ………………………41%
- Jewish ……………………………...2%
- Muslim ………………………………1%
- Hindu ……………………………<1%
- Other Religion (including agnostic)……. 21%
- or Atheist …………………………..6%
- Not Sure (Volunteered)……….3%
Q27: What is your highest level of education? (READ LIST)
- Less than High School …………………..4%
- High School Graduate ……………….. .31%
- Some college or technical school…..23%
- College graduate (4 year only)………27%
- Graduate or Professional Degree……14%
- Not Sure…………………………………........<1%
Q28: Which of the following categories best describes your family income? Is it (READ LIST)?
- Under $20,000 …………………………...11%
- $20,000-$40,000 ……………………… 14%
- $40,000-$60,000 ……………………… 15%
- $60,000-$80,000 ……………………… 14%
- $80,000-$100,000 ………………………12%
- Over $100,000 …………………………...28%
- Not Sure (Volunteered) ………………...7%
Q29: Which of the following categories does your current age fall in? Is it (READ LIST)?
- 18-34……………………………..21%
- 35-50……………………………..24%
- 51-64 …………………………….28%
- 65- and over…………………..27%
Q30: Finally, to which gender identity do you most identify? (READ LIST)
- Male……………………………………………………….48%
- Female……………………………………………………52%
- Transgender Male…………………………………<1%
- Transgender Female…………………………….<1%
- Or you do not identify as male, female or transgender……<1%
SELECTED CROSSTABS
“The final results of the election accurately reflected how Pennsylvanians voted.”
|
Very Confident |
Somewhat Confident |
Not Too |
Not Confident at All |
Not Sure |
|
|
OVERALL |
49% |
8% |
6% |
34% |
3% |
|
Female |
54% |
9% |
4% |
29% |
4% |
|
Male |
43% |
8% |
8% |
40% |
2% |
|
Democrat |
82% |
9% |
2% |
6% |
2% |
|
Republican |
14% |
6% |
11% |
68% |
2% |
|
Independent |
56% |
14% |
0% |
25% |
6% |
|
College Degree |
65% |
7% |
6% |
19% |
2% |
|
No College Degree |
37% |
9% |
6% |
45% |
3% |
|
White |
43% |
8% |
7% |
40% |
3% |
|
Non White |
73% |
9% |
3% |
14% |
3% |
|
Trump Voter |
8% |
8% |
12% |
69% |
4% |
|
Biden Voter |
88% |
9% |
1% |
2% |
2% |
|
18-34 |
58% |
15% |
6% |
18% |
4% |
|
35-50 |
48% |
5% |
10% |
33% |
4% |
|
51-64 |
47% |
8% |
3% |
42% |
1% |
|
65 and Over |
46% |
6% |
6% |
39% |
4% |
“Which of the following do you think was the biggest threat to Pennsylvania having a safe, secure and accurate election in 2020?”
|
Foreign Interference in the Election |
Voting Machines Malfunctioning |
Voter Fraud |
Suppression of Individuals from Voting |
Other Factor |
Not Sure |
|
|
OVERALL |
5% |
5% |
33% |
30% |
13% |
15% |
|
Female |
3% |
4% |
30% |
35% |
11% |
19% |
|
Male |
7% |
6% |
37% |
23% |
16% |
11% |
|
Democrat |
6% |
4% |
8% |
46% |
13% |
23% |
|
Republican |
3% |
7% |
59% |
10% |
13% |
7% |
|
Independent |
3% |
0% |
33% |
36% |
14% |
14% |
|
College Degree |
6% |
5% |
21% |
41% |
18% |
10% |
|
No College Degree |
4% |
5% |
41% |
22% |
10% |
18% |
|
White |
5% |
5% |
37% |
26% |
13% |
13% |
|
Non White |
4% |
4% |
17% |
43% |
12% |
21% |
|
Trump Voter |
3% |
7% |
62% |
11% |
10% |
8% |
|
Biden Voter |
6% |
3% |
6% |
48% |
17% |
22% |
|
18-34 |
4% |
6% |
24% |
47% |
11% |
8% |
|
35-50 |
3% |
3% |
33% |
33% |
13% |
14% |
|
51-64 |
9% |
4% |
37% |
26% |
17% |
8% |
|
65 and over |
3% |
6% |
35% |
17% |
12% |
27% |
“The spread of fake news and misinformation on the internet is a serious threat to our democracy.”
|
Strongly Agree |
Somewhat Agree |
Somewhat Disagree |
Strongly Disagree |
Not Sure |
|
|
OVERALL |
68% |
19% |
5% |
4% |
4% |
|
Female |
67% |
18% |
7% |
4% |
4% |
|
Male |
68% |
21% |
3% |
5% |
4% |
|
Democrat |
60% |
22% |
7% |
6% |
5% |
|
Republican |
73% |
18% |
3% |
3% |
3% |
|
Independent |
76% |
11% |
3% |
5% |
5% |
|
College Degree |
65% |
21% |
7% |
6% |
2% |
|
No College Degree |
70% |
19% |
2% |
4% |
5% |
|
White |
73% |
17% |
4% |
3% |
3% |
|
Non White |
48% |
28% |
7% |
10% |
7% |
|
Trump Voter |
76% |
16% |
3% |
1% |
4% |
|
Biden Voter |
61% |
21% |
7% |
7% |
4% |
|
18-34 |
66% |
18% |
6% |
6% |
4% |
|
35-50 |
68% |
20% |
4% |
5% |
3% |
|
51-64 |
61% |
28% |
7% |
3% |
2% |
|
65 and over |
75% |
12% |
2% |
4% |
7% |
Favorability of the Black Lives Matter Movement in Relation to the Party Affiliation of Respondents:
|
Very Favorable |
Somewhat Favorable |
Somewhat Unfavorable |
Very Unfavorable |
Not Sure |
|
|
OVERALL |
31% |
20% |
8% |
31% |
10% |
|
Democrat |
59% |
22% |
5% |
7% |
8% |
|
Republican |
3% |
15% |
14% |
57% |
11% |
|
Independent |
30% |
24% |
3% |
24% |
19% |
Trust in the U.S. Supreme Court in Relation to Party Affiliation:
|
Strongly Trust |
Somewhat |
Somewhat |
Strongly Distrust |
Not Sure |
|
|
OVERALL |
30% |
41% |
12% |
5% |
14% |
|
Democrat |
23% |
49% |
17% |
3% |
9% |
|
Republican |
32% |
36% |
10% |
5% |
18% |
|
Independent |
42% |
28% |
3% |
11% |
17% |
Trust in the Pennsylvania Supreme Court in Relation to Party Affiliation:
|
Strongly Trust |
Somewhat Trust |
Somewhat Distrust |
Strongly Distrust |
Not Sure |
|
|
OVERALL |
19% |
36% |
9% |
14% |
24% |
|
Democrat |
29% |
43% |
7% |
2% |
19% |
|
Republican |
8% |
28% |
12% |
24% |
27% |
|
Independent |
17% |
33% |
0% |
25% |
25% |