Muhlenberg College/Morning Call
PA 7th Congressional District Survey - October 2024
PDF: Muhlenberg College/Morning Call PA 7th Congressional District October 2024 Survey
PDF: County Residence and Voters Preference in the 7th District
Key Findings:
1. With Election Day 2024 less than a month away the race in Pennsylvania’s 7th Congressional District is once again highly competitive, as the latest Muhlenberg College/Morning Call poll finds Congresswoman Susan Wild (D) holding a 51% to 45% lead over State Representative Ryan Mackenzie (R).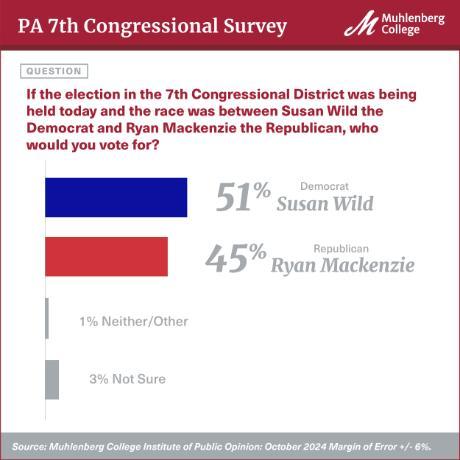
2. Wild’s slim lead in the poll is fueled by a wide advantage among 7th District voters that hold a 4 year college degree, with Wild leading 62% to 37% in this group while trailing Mackenzie 51% to 43% among voters without a 4 year degree.
3. Within the 7th Congressional District, the Presidential race is highly contested with Vice President Kamala Harris holding a thin 50% to 47% lead over former President Donald Trump.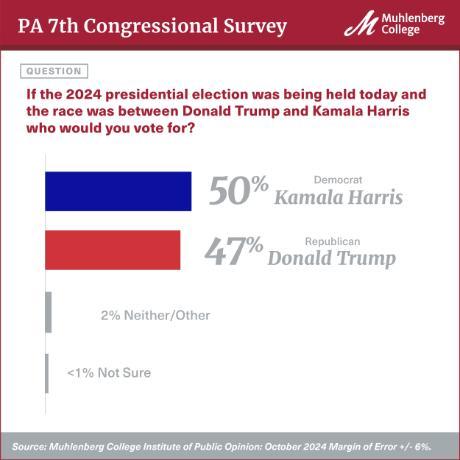
4. Three-term Senator Bob Casey Jr. (D) maintains a modest 51% to 45% lead over his Republican challenger Dave McCormick among 7th Congressional District voters.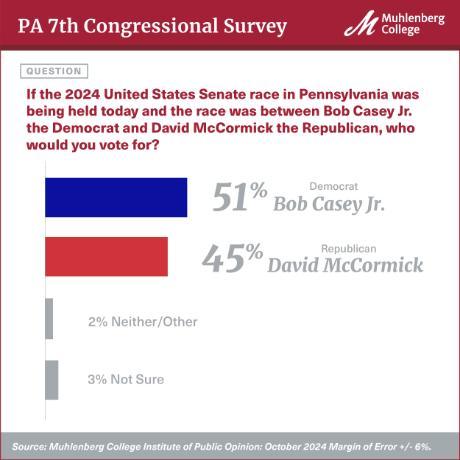
5. The economy (including inflation) stands out as the most important issue to 7th District voters in terms of their 2024 election decision, with 29% of voters identifying economic matters as the top issue. Immigration (7%), abortion/reproductive rights (7%) and democracy/democratic norms (7%) were also commonly identified as the most important issue to voters in the PA 7th.
Methodological Statement:
The following report contains the results of a telephone survey of (459) likely voters in the Pennsylvania 7th Congressional District between September 30 and October 3, 2024. Respondents were interviewed in English on both landlines (101) and cell phones (358). With a randomly selected sample of respondents the margin of error for the surveys is +/- 6% at a 95% level of confidence. Margins of error for questions with smaller sample size will be larger. In addition to sampling error, one should consider that question wording and other fielding issues can introduce error or bias into survey results. Interviewing was conducted by Communication Concepts of Easton, Pennsylvania under protocols established by the Muhlenberg College Institute of Public Opinion (MCIPO). The data has been weighted to gender, age, region, party, race and educational attainment to reflect voter population parameters. The calculation of sampling error takes into account design effects due to the weighting identified above. In order to reach a representative sample of registered voters both land lines and cell phones were called up to 3 times. The sampling frame for the study is from the registered voters files of the Commonwealth of Pennsylvania. To determine likely voters, only voters who have voted in 1 or more of the last 4 general elections (2020-2023), or who is a new registrant since November of 2020 were included in the sampling frame. In addition, only survey respondents from this frame who indicated that they were “definitely” or “very likely” to vote in the November election were included in the sample. Due to rounding the totals provided in the frequency report may not total 100%. The survey instrument (presented in its entirety below) was designed by Dr. Christopher P. Borick and Dr. Lindsay Burt of the MCIPO. The survey was funded exclusively by the Morning Call and the MCIPO. For more detailed information on the methods employed please contact the MCIPO at 484-664-3444 or email Dr. Borick at [email protected]
SURVEY INSTRUMENT
PENNSYLVANIA 7th CONGRESSIONAL DISTRICT POLL
Q1: Thank you. Which of the following categories best describes your current voting status? Are you registered as a ______? (READ LIST):
Democrat…………………. 42%
Republican………………… 43%
Independent……………….. 14%
Other Party………………… 1%
Q2: How likely are you to vote in the elections this November? Are you definitely going to vote, very likely to vote, not too likely to vote or definitely not voting in the November Election?
Definitely Going to Vote……… 91%
Very Likely To Vote………...... 9%
Q3: Next, I would like for you to rate the performance of a few political officials. For each name that I read, please tell me if you approve or disapprove of the way he or she is doing their job.
First, President Joe Biden?
Approve…………………. 42%
Disapprove………………. 52%
No opinion (Vol)…………. 6%
Q4: Next, Governor Josh Shapiro?
Approve………………. 55%
Disapprove…………… 24%
No opinion (Vol)……… 21%
Q5: Next, Congresswoman Susan Wild?
Approve………………….. 47%
Disapprove……………… 35%
No opinion (Vol)………… 19%
(ROTATE Questions 6-7)
Q6: Now, I would like to ask your overall impression of a few political figures. For each name I read, please tell me if your impression of them is favorable or unfavorable.
First, Susan Wild:
Favorable………………….. 47%
Unfavorable……………….. 36%
Neutral/Not Sure……….…. 15%
Haven't Heard of Her……… 3%
Q7: Ryan Mackenzie:
Favorable………………….. 30%
Unfavorable………………… 25%
Neutral/Not Sure…………… 25%
Haven't Heard of Him………. 20%
Q8: Now, if the 2024 presidential election was being held today and the race was between Donald Trump and Kamala Harris who would you vote for? (OPTIONS ROTATED)
Trump (Skip to Q10)………………. 47%
Harris (Skip to Q10)……………… 50%
Neither/Other (Vol) (Skip to Q10).. 2%
Not Sure (Vol)…………………….. 2%
Q9: Are you leaning more toward voting for Donald Trump or Kamala Harris? (OPTIONS ROTATED) (ASKED ONLY OF THOSE THAT SAID, “NOT SURE” ON Q8) (n = 7)
Trump……………………… 33%
Harris………………………. 45%
Not Sure (Vol)……………… 22%
PRESIDENTIAL RACE WITH LEANERS
Trump……………..……… 47%
Harris…………………….. 50%
Neither/Other (Vol)……… 2%
Not Sure (Vol)…………… <1%
Q10 Next, if the 2024 United States Senate race in Pennsylvania was being held today and the race was between Bob Casey Jr. the Democrat and David McCormick the Republican, who would you vote for?
Casey (Skip to Q12)………………. 51%
McCormick (Skip to Q12)………… 44%
Neither/Other (Vol) (Skip to Q12)…. 1%
Not Sure (Vol)……………………. 4%
Q11: Are you leaning more toward voting for Bob Casey Jr. or David McCormick? (OPTIONS ROTATED) (ASKED ONLY OF THOSE THAT SAID, “NOT SURE” ON Q10) (n = 20)
Casey……………………. 5%
McCormick……………….. 24%
Neither/Other (Vol)……….. 13%
Not Sure (Vol)…………….. 58%
SENATE RACE WITH LEANERS
Casey………………………. 51%
McCormick………………… 45%
Neither/Other (Vol)………… 2%
Not Sure (Vol)……………… 3%
Q12: Now, if the election in the 7th Congressional District was being held today and the race was between Democrat Susan Wild and Republican Ryan Mackenzie, who would you vote for? (OPTIONS ROTATED)
Susan Wild………………… 51%
Ryan Mackenzie…………… 43%
Neither/Other (Vol)……….. 1%
Not Sure (Vol)…………….. 5%
Q13: Are you leaning more toward voting for Susan Wild or Ryan Mackenzie? (OPTIONS ROTATED) (ASKED ONLY OF THOSE THAT SAID “NOT SURE” IN Q12) (n = 21)
Susan Wild…………………. 8%
Ryan Mackenzie……………. 33%
Not Sure (Vol)……………… 59%
7th CONGRESSIONAL DISTRICT RACE WITH LEANERS
Susan Wild………………… 51%
Ryan Mackenzie…………… 45%
Neither/Other (Vol)……….. 1%
Not Sure (Vol)…………….. 3%
Q14: What is the most important issue for you in terms of deciding your vote in the 2024 presidential election? (Open Ended)
Economy/Inflation……………………………….. 29%
Immigration……………………………………… 12%
Abortion/Reproductive Rights……………………. 7%
Democracy/Democratic Norms………………….. 7%
Character of Candidate………………………….. 6%
Women's Rights…………………………………. 5%
In Favor or Against Specific Candidate or Party… 4%
Health Care/Social Security……………………… 4%
Foreign Policy/National Security…………………. 3%
Climate Change………………………………….. 1%
International Conflicts……………………………. <1%
Gun Control/2nd Amendment……………………. <1%
Not Sure………………………………………… 5%
Other……………………………………………. 16%
Q15: Do you think abortion should be:
Legal in all cases……………. 29%
Legal in most cases…………. 44%
Illegal in most cases…………. 13%
Illegal in all cases……………. 4%
Not Sure (Vol)……………… 7%
Refused (Vol)………………. 3%
How confident are you that, across the country, votes cast in the following methods will be accurately cast and counted in this November’s elections? First: (ROTATE OPTIONS)
|
Very Confident |
Somewhat Confident |
Not Too Confident |
Not at all Confident |
Not Sure (Vol) | |
|---|---|---|---|---|---|
|
Q16: Paper Ballots |
44% |
26% |
15% |
12% |
3% |
|
Q17: Electronic Voting systems |
50% |
28% |
9% |
11% |
2% |
|
Q18: Mail ballots |
35% |
25% |
14% |
24% |
2% |
Q19. Which of the following do you think is the biggest threat to Pennsylvania having a safe, secure and accurate election in 2024? (ROTATE OPTIONS)
Foreign interference in the election………… 16%
Voting machines malfunctioning……………. 6%
Voter fraud………………………………….. 29%
The use of mail ballots……………………….. 11%
Suppression of individuals from voting…….. 24%
Other factor (Vol)……………………………. 5%
Not Sure (Vol)………………………………. 9%
Q20: Which of these best describes your actions in the 2020 presidential election? Did you vote for (READ LIST):
Joe Biden…………………………………………………. 48%
Donald Trump…………………………………………… 41%
A candidate other than Biden or Trump…………………. 3%
Or, did you not vote in the 2020 presidential election… 7%
Not Sure (Vol)…………………………………………….. 1%
Refused (Vol).…………………………………………….. 1%
Q21: Finally, I have a few questions about yourself. Which of the following categories best describes your racial identity? Are you (READ LIST):
White/Caucasian……………. 77%
African American…………… 6%
Hispanic……………………. 5%
Latino………………………. 3%
Asian………………………. 1%
Native American………….. <1%
Mixed race…………………. 5%
Other………………………. 4%
Q22: Which of the following categories best describes your religious affiliation? Are you (READ LIST):
Catholic…………………………………. 35%
Protestant……………………………….. 26%
Jewish………………………………….. 2%
Muslim…………………………………. <1%
Hindu…………………………………… <1%
Other Religion (Including Agnostic)…… 25%
Atheist………………………………….. 10%
Not Sure (Vol)…………………………. 3%
Q23: What is your highest level of education? (READ LIST):
Less than High School……………………. 1%
High School Graduate……………………. 23%
Some College or Technical School……….. 33%
College graduate (4 yr. only)……………… 27%
Graduate or professional degree…………. 17%
Q24: Which of the following categories best describes your family income? Is it (READ LIST):
Under $20,000………………… 3%
$20,000-$40,000……………… 15%
$40,000-$60,000……………… 16%
$60,000-$80,000……………… 13%
$80,000-$100,000…………….. 11%
Over $100,000………………… 32%
Not Sure (Vol)…………………. 10%
Q25: Which of the following categories does your current age fall in? Is it (READ LIST):
18-34………………………. 16%
35-50………………………. 27%
51-64………………………. 31%
65 and over…………………. 26%
Q26: Finally, to which gender identity do you most identify? (READ LIST):
Male……………………………………………………… 49%
Female……………………………………………………. 50%
You do not identify as male, female, or transgender………… 1%
SELECTED CROSSTABS
Trump vs. Harris
(Including Leaners)
|
|
Trump |
Harris |
Neither/Other |
Not Sure |
|---|---|---|---|---|
|
Overall |
47% |
50% |
2% |
<1% |
|
Male |
54% |
45% |
1% |
<1% |
|
Female |
41% |
56% |
3% |
<1% |
|
White |
51% |
47% |
2% |
<1% |
|
Person of Color |
27% |
69% |
3% |
0% |
|
No 4 Year Degree |
53% |
43% |
3% |
<1% |
|
4 Year Degree |
39% |
60% |
2% |
0% |
|
18-34 |
47% |
52% |
1% |
0% |
|
35-50 |
42% |
54% |
4% |
0% |
|
51-64 |
50% |
48% |
3% |
0% |
|
Over 65 |
49% |
48% |
1% |
2% |
|
Biden 2020 |
6% |
91% |
3% |
1% |
|
Trump 2020 |
97% |
3% |
0% |
0% |
|
Democrat |
4% |
95% |
1% |
1% |
|
Republican |
87% |
11% |
3% |
0% |
|
Independent |
51% |
42% |
6% |
2% |
|
“Definitely Voting” |
47% |
50% |
3% |
<1% |
|
“Very Likely to Vote” |
48% |
50% |
0% |
2% |
|
Catholic |
55% |
45% |
0% |
0% |
|
Protestant |
53% |
44% |
2% |
1% |
|
Non-Christian/No Religion |
37% |
59% |
4% |
<1% |
Casey vs. McCormick
(Including Leaners)
|
|
Casey |
McCormick |
Neither/Other |
Not Sure |
|---|---|---|---|---|
|
Overall |
51% |
45% |
2% |
2% |
|
Male |
47% |
49% |
1% |
2% |
|
Female |
54% |
41% |
3% |
3% |
|
White |
47% |
49% |
2% |
2% |
|
Person of Color |
68% |
26% |
1% |
5% |
|
No 4 Year Degree |
46% |
49% |
2% |
3% |
|
4 Year Degree |
58% |
40% |
1% |
2% |
|
18-34 |
58% |
38% |
3% |
1% |
|
35-50 |
55% |
39% |
1% |
5% |
|
51-64 |
45% |
52% |
2% |
1% |
|
Over 65 |
49% |
47% |
2% |
3% |
|
Biden 2020 |
90% |
6% |
1% |
3% |
|
Trump 2020 |
4% |
93% |
2% |
1% |
|
Democrat |
94% |
2% |
1% |
3% |
|
Republican |
10% |
86% |
2% |
2% |
|
Independent |
49% |
44% |
5% |
3% |
|
“Definitely Voting” |
50% |
46% |
2% |
3% |
|
“Very Likely to Vote” |
57% |
38% |
5% |
0% |
|
Catholic |
44% |
52% |
3% |
3% |
|
Protestant |
44% |
50% |
3% |
3% |
|
Non-Christian/No Religion |
62% |
35% |
1% |
2% |
Wild vs. Mackenzie
(Including Leaners)
|
|
Wild |
Mackenzie |
Neither/Other |
Not Sure |
|---|---|---|---|---|
|
Overall |
51% |
45% |
1% |
3% |
|
Male |
45% |
49% |
3% |
4% |
|
Female |
56% |
42% |
0% |
2% |
|
White |
47% |
50% |
1% |
3% |
|
Person of Color |
72% |
24% |
1% |
3% |
|
No 4 Year Degree |
43% |
51% |
2% |
5% |
|
4 Year Degree |
62% |
37% |
1% |
0% |
|
18-34 |
45% |
48% |
3% |
4% |
|
35-50 |
54% |
39% |
2% |
5% |
|
51-64 |
52% |
45% |
1% |
1% |
|
Over 65 |
51% |
48% |
0% |
2% |
|
Biden 2020 |
90% |
7% |
1% |
3% |
|
Trump 2020 |
7% |
90% |
2% |
1% |
|
Democrat |
93% |
3% |
1% |
4% |
|
Republican |
13% |
84% |
2% |
1% |
|
Independent |
48% |
48% |
2% |
3% |
|
“Definitely Voting” |
52% |
44% |
1% |
3% |
|
“Very Likely to Vote” |
45% |
50% |
0% |
5% |
|
Catholic |
43% |
54% |
2% |
<1% |
|
Protestant |
47% |
48% |
0% |
5% |
|
Non-Christian/No Religion |
61% |
34% |
2% |
3% |
Top 4 Most Important Issues in Deciding Vote in the 2024 Presidential Election x Registered Party
|
|
Economy/ |
Immigration |
Abortion/ |
Democracy/ |
|---|---|---|---|---|
|
Democrat |
13% |
1% |
10% |
15% |
|
Republican |
42% |
24% |
2% |
2% |
|
Independent |
28% |
12% |
15% |
2% |
Biggest Threat to PA Having a Safe, Secure and Accurate Election in 2024 x Registered Party
|
Foreign interference in election |
Voting machines malfunctioning |
Voter fraud |
The use of mail ballots |
Suppression of individuals from voting |
Other factor (Vol) |
Not Sure (Vol) | |
|---|---|---|---|---|---|---|---|
|
Democrat |
28% |
6% |
6% |
3% |
40% |
5% |
12% |
|
Republican |
8% |
7% |
50% |
17% |
8% |
5% |
6% |