Muhlenberg College Public Health Program - 2022 Pennsylvania Health Poll
The following report provides findings from the annual Muhlenberg College Public Health Program Poll of Pennsylvanians on public health issues. This year’s survey examined topics that included the COVID-19 outbreak and the performance of President Biden and Governor Wolf’s handling of the pandemic, heroin addiction, immunizations and marijuana legalization. The survey marks the 10th year of this initiative that is a partnership between the Muhlenberg College Institute of Public Opinion and the Muhlenberg College Public Health Program.
PDF: Spring 2022 - Muhlenberg College Public Health Program | Pennsylvania Health Poll
Key Findings
- After two full years of the COVID-19 pandemic, Pennsylvanians are increasingly optimistic that the worst of the pandemic is behind us. Currently, 76% of Commonwealth residents agree that COVID’s worst impacts are in the past, marking a 19-point increase from November when 57% of Pennsylvanians maintained this opinion.
.jpg)
- A vast majority (84%) of Pennsylvanians support moving the state away from COVID-19 limits, but among this cohort, there are divisions on the details. Just under half of state residents (47%) support opening up but keeping some precautions. About a third (37%) of Pennsylvanians prefer that the state open up with no COVID-19 mandates or requirements.
- Pennsylvanians remain highly divided on President Biden’s handling of the COVID-19 pandemic, with 43% approving and 48% disapproving of the 46th President’s performance on this matter. These marks are similar to those from last fall, and significantly more negative than a year ago when 55% approved, and only 25% disapproved of Biden’s work on the pandemic.
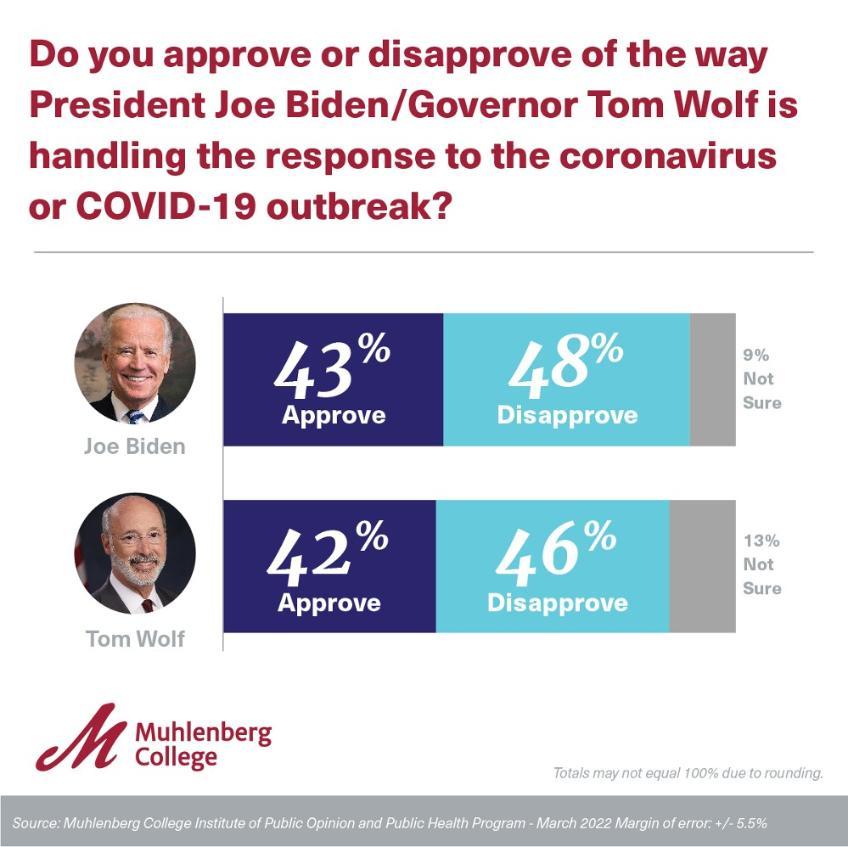
- Governor Wolf’s COVID-19 efforts continue to draw mixed reviews from Pennsylvanians, with 42% of state residents approving, and 46% disapproving of the job he has done on the pandemic.
- About 6 in 10 Commonwealth residents reported they are likely to get an annual COVID-19 booster if one becomes available, with 43% “very likely” and 17% “somewhat likely” to receive this immunization.
-846x845.jpg)
- Keystone States resident views on the quality of health care in the state have declined from pre-pandemic levels, with the percentage of Pennsylvanians rating health care in the state as excellent or good falling from 67% to 55% between 2019 and 2022.
- As discussions on the legalization of marijuana for recreational use continue in Pennsylvania, opposition to this possibility continues a long-term decline. Only 1 in 4 adult Pennsylvanians now oppose legalization in the state, with a solid majority (56%) supporting a change to the existing law.
Methodological Statement
The following report contains the results of a telephone survey of 423 adults in the Commonwealth of Pennsylvania between February 15 and March 8, 2022. Respondents were interviewed in English on both landlines (94) and cell phones (329). With a randomly selected sample of respondents, the margin of error for the surveys is +/- 5.5% at a 95% level of confidence. Margins of error for questions with smaller sample size will be larger. In addition to sampling error, one should consider that question wording and other fielding issues could introduce error or bias into survey results. The sample data has been weighted by gender, race, age, income, and educational attainment to reflect those Pennsylvania population characteristics as reported by the United States Census Bureau in 2022. The calculation of sampling error considers design effects due to the weighting identified above. In order to reach a representative sample of adult Pennsylvanians, both landlines and cell phones are called up to 5 times. The response rate for this survey as calculated using the American Association of Public Opinion Research (AAPOR) RRII formula is approximately 5%. Due to rounding the totals provided in the frequency report may not total 100%. The survey instrument (as seen in its entirety below) was designed by Dr. Christopher P. Borick, Director of the Muhlenberg College Institute of Public Opinion and Professor in the Muhlenberg College Public Health Program. The survey was funded exclusively by Muhlenberg College. For more detailed information on the methods employed please contact the MCIPO at 484-664-3444 or email Dr. Borick at [email protected].
INSTRUMENT AND FREQUENCY REPORT
SCREENER: Thank you. Just to confirm are you a resident of Pennsylvania who is age 18 or older?
- Yes…………..…..CONTINUE
- No………………THANK AND DISCONTINUE
- Not Sure….……. THANK AND DISCONTINUE
(HEALTH INSURANCE/GENERAL HEALTH CARE)
Q1: In general, would you describe the quality of health care in Pennsylvania as excellent, good, fair or poor?
- Excellent………..13%
- Good……..……..42%
- Fair……………..30%
- Poor…………….12%
- Not Sure (VOL)...3%
|
|
Spring 2019 |
Spring 2020 |
Spring 2021 |
Spring 2022 |
|
Excellent |
20% |
17% |
14% |
13% |
|
Good |
47% |
42% |
48% |
42% |
|
Fair |
25% |
24% |
23% |
30% |
|
Poor |
5% |
16% |
12% |
12% |
|
Not Sure |
3% |
<1% |
4% |
3% |
Q2: Do you think it is the responsibility of the federal government to make sure all Americans have health care coverage, or is that not the responsibility of the federal government?
- Is a federal responsibility…………….59%
- Is not a federal responsibility……….36%
- Not Sure (VOL)……...……………… 5%
|
|
Spring 2019 |
Spring 2020 |
Spring 2021 |
Spring 2022 |
|
Is a federal responsibility |
54% |
59% |
61% |
59% |
|
Is not a federal responsibility |
38% |
33% |
31% |
36% |
|
Not Sure |
9% |
9% |
8% |
5% |
(MARIJUANA AND OPIOIDS)
Q3: Next, I would like to ask you a question about marijuana. First, do you favor, oppose or neither favor nor oppose the complete legalization of the use of marijuana for any purpose?
- Favor………………………56%
- Oppose…………………….25%
- Neither Favor nor Oppose…18%
- Not Sure (VOL)…………. 1%
|
|
Spring 2013 |
Spring 2014 |
Spring 2016 |
Spring 2017 |
Spring 2018 |
Spring 2019 |
Spring 2020 |
Spring 2021 |
Spring 2022 |
|
Favor |
33% |
38% |
39% |
45% |
49% |
51% |
56% |
58% |
56% |
|
Oppose |
40% |
35% |
38% |
29% |
30% |
28% |
26% |
26% |
25% |
|
Neither Favor or Oppose |
24% |
22% |
20% |
23% |
19% |
18% |
12% |
14% |
18% |
|
Not Sure |
3% |
4% |
3% |
3% |
3% |
3% |
6% |
3% |
1% |
Q4: How serious of a problem do you think heroin abuse in America is? (READ LIST)
- Very Serious………….…82%
- Somewhat Serious………14%
- Not at all Serious…….…. 3%
- Not sure (VOL)………….2%
|
|
Spring 2016 |
Spring 2017 |
Spring 2018 |
Spring 2019 |
Spring 2020 |
Spring 2021 |
Spring 2022 |
|
Very Serious |
75% |
87% |
84% |
81% |
82% |
81% |
82% |
|
Somewhat Serious |
17% |
10% |
14% |
17% |
13% |
16% |
14% |
|
Not at All Serious |
2% |
1% |
1% |
1% |
1% |
1% |
3% |
|
Not Sure |
7% |
2% |
2% |
1% |
4% |
2% |
2% |
Q5: Do you personally know anyone who has been addicted to heroin or another opiate?
- Yes……………….. 60%
- No………………... 40%
- Not Sure………….<1%
|
|
Spring 2016 |
Spring 2017 |
Spring 2018 |
Spring 2019 |
Spring 2020 |
Spring 2021 |
Spring 2022 |
|
Yes |
52% |
58% |
55% |
64% |
63% |
59% |
60% |
|
No |
44% |
40% |
45% |
34% |
37% |
41% |
40% |
|
Not Sure |
4% |
2% |
1% |
2% |
<1% |
<1% |
<1% |
(COVID-19)
Q6: Next I have a few questions about the coronavirus or COVID-19 outbreak. How concerned are you, if at all, about the coronavirus or COVID-19 outbreak? (READ LIST)
- Extremely Concerned…..13%
- Very Concerned………...24%
- Somewhat Concerned…..35%
- Not Concerned at All……27%
|
|
Spring 2021 |
Fall 2021 |
Spring 2022 |
|
Extremely Concerned |
26% |
15% |
13% |
|
Very Concerned |
31% |
26% |
24% |
|
Somewhat Concerned |
28% |
34% |
35% |
|
Not Concerned at All |
15% |
26% |
27% |
|
Not Sure (VOL) |
<1% |
<1% |
0% |
Q7: Do you approve or disapprove of the way President Joe Biden is handling the response to the coronavirus or COVID-19 outbreak?
- Approve………………..43%
- Disapprove…………….48%
- Not Sure……………… 9%
|
|
Spring 2021 |
Fall 2021 |
Spring 2022 |
|
Approve |
55% |
40% |
43% |
|
Disapprove |
28% |
45% |
48% |
|
Not Sure (VOL) |
19% |
15% |
9% |
Q8: Do you approve or disapprove of the way Governor Tom Wolf is handling the response to the coronavirus or COVID-19 outbreak?
- Approve………………..42%
- Disapprove…………….46%
- Not Sure………………13%
|
|
Spring 2021 |
Fall 2021 |
Spring 2022 |
|
Approve |
40% |
35% |
42% |
|
Disapprove |
41% |
44% |
46% |
|
Not Sure (VOL) |
19% |
21% |
13% |
Q9: Have you received at least 1 COVID-19 vaccine shot at this time?
- Yes …………………….78%
- No………………………21%
- Not Sure……………….1%
|
|
Spring 2021 |
Fall 2021 |
Spring 2022 |
|
Yes |
36% |
74% |
78% |
|
No |
64% |
26% |
21% |
|
Not Sure (VOL) |
1% |
0% |
1% |
Q10: If an annual COVID-19 booster shot becomes available, how likely are you to receive one? (READ LIST)
- Very Likely……………43%
- Somewhat Likely……...17%
- Somewhat Unlikely…… 7%
- Very Unlikely………….29%
- Not Sure……………….. 3%
Q11: Which of the following is closest to your opinion of how the United States should handle the COVID-19 pandemic at this time? (READ LIST)
- We should open up and get back to life as usual with no COVID-19 mandates or requirements…………………………………………………………………………..37%
- We should move to opening up, but still take some precautions……………………..47%
- We should mostly keep COVID-19 precautions and requirements in place……….…11%
- We should increase mask mandates and COVID-19 vaccine requirements…………...5%
- Not Sure………………………………………………………………………………...1%
(MENTAL HEALTH)
Q12: How would you describe your own mental health or emotional well-being at this time? Would you say it is -- excellent, good, only fair, or poor?
- Excellent……………35%
- Good………………..44%
- Only Fair……………17%
- Poor………………… 4%
- Not Sure…………….<1%
|
|
Spring 2021 |
Spring 2022 |
|
Excellent |
33% |
35% |
|
Good |
45% |
44% |
|
Only Fair |
19% |
17% |
|
Poor |
3% |
4% |
|
Not Sure |
1% |
<1% |
Q13: Compared to 12 months ago, would you say your mental health or emotional well-being is much better, somewhat better, somewhat worse, much worse or about the same as a year ago?
- Much Better………………………….12%
- Somewhat Better…………………….19%
- Somewhat Worse…………………… 9%
- Much Worse…………………………. 3%
- About the Same as a Year Ago………56%
|
|
Spring 2021 |
Spring 2022 |
|
Much Better |
9% |
12% |
|
Somewhat Better |
17% |
19% |
|
Somewhat Worse |
18% |
9% |
|
Much Worse |
4% |
3% |
|
About the Same as a Year Ago |
53% |
56% |
|
Not Sure |
<1% |
0% |
Q14: During the past two months, have you had any problems with your work or other regular daily activities as a result of any emotional problems, such as feeling depressed or anxious?
- Yes………………19%
- No……………….81%
- Not Sure…………<1%
|
|
Spring 2021 |
Spring 2022 |
|
Excellent |
17% |
19% |
|
Good |
82% |
81% |
|
Not Sure |
1% |
<1% |
PUBLIC HEALTH ISSUES
Q15: Please indicate if you strongly agree, somewhat agree, somewhat disagree or strongly disagree with the following statements. First, the chances of a child getting autism are increased if they receive the recommended childhood immunizations.
- Strongly Agree………..…7%
- Somewhat Agree………. 8%
- Somewhat Disagree……. 26%
- Strongly Disagree……… 41%
- Not Sure (Vol)…………18%
|
|
Spring 2013 |
Spring 2014 |
Spring 2015 |
Spring 2016 |
Spring 2017 |
Spring 2018 |
Spring 2019 |
Spring 2020 |
Spring 2021 |
Spring 2022 |
|
Strongly Agree |
5% |
8% |
7% |
6% |
4% |
8% |
9% |
8% |
5% |
7% |
|
Somewhat Agree |
13% |
13% |
10% |
13% |
13% |
13% |
9% |
8% |
6% |
8% |
|
Somewhat Disagree |
22% |
21% |
22% |
16% |
14% |
14% |
16% |
13% |
12% |
26% |
|
Strongly Disagree |
35% |
39% |
48% |
51% |
48% |
49% |
55% |
57% |
52% |
41% |
|
Not Sure |
26% |
19% |
12% |
14% |
21% |
16% |
11% |
15% |
25% |
18% |
Q16: Immunizations pose little health risks to those that receive them.
- Strongly Agree………..…41%
- Somewhat Agree………. 34%
- Somewhat Disagree……. 12%
- Strongly Disagree……… 10%
- Not Sure (Vol)…………. 4%
|
|
Spring 2019 |
Spring 2020 |
Spring 2021 |
Spring 2022 |
|
Strongly Agree |
54% |
49% |
41% |
41% |
|
Somewhat Agree |
23% |
25% |
30% |
34% |
|
Somewhat Disagree |
9% |
8% |
9% |
12% |
|
Strongly Disagree |
9% |
8% |
3% |
10% |
|
Not Sure |
4% |
10% |
17% |
4% |
Q17: The worst of the COVID-19 pandemic is behind us.
- Strongly Agree………..…36%
- Somewhat Agree………. 40%
- Somewhat Disagree……. 13%
- Strongly Disagree………. 6%
- Not Sure (Vol)…………. 6%
|
|
Spring 2021 |
Fall 2021 |
Spring 2022 |
|
Strongly Agree |
14% |
16% |
36% |
|
Somewhat Agree |
46% |
41% |
40% |
|
Somewhat Disagree |
16% |
19% |
13% |
|
Strongly Disagree |
9% |
10% |
6% |
|
Not Sure (VOL) |
16% |
13% |
6% |
Q18: Adults who have not received a COVID-19 vaccination have put others at risk and have prolonged the length of the pandemic.
- Strongly Agree………..…34%
- Somewhat Agree………. 18%
- Somewhat Disagree……. 11%
- Strongly Disagree………. 36%
- Not Sure (Vol)…………. 2%
(THREATS TO PUBLIC HEALTH)
Q19: Next I’m going to read you a list of factors that may or may not affect the health of the public in Pennsylvania. For each factor that I note please indicate if you think that factor poses a major risk, minor risk or no risk to public health in Pennsylvania. First, (ROTATE QUESTIONS)
Obesity
- Major Risk………………62%
- Minor Risk………………32%
- No Risk………………….. 5%
- Not sure………………….1%
Q20: Next, fracking for natural gas and oil.
- Major Risk………………27%
- Minor Risk………………40%
- No Risk…………………..21%
- Not sure…………………13%
|
|
Spring 2019 |
Spring 2020 |
Spring 2021 |
Spring 2022 |
|
Major Risk |
38% |
36% |
27% |
27% |
|
Minor Risk |
39% |
31% |
32% |
40% |
|
No Risk |
3% |
9% |
16% |
21% |
|
Not Sure |
11% |
24% |
25% |
13% |
Q21: Climate change
- Major Risk………………47%
- Minor Risk………………28%
- No Risk…………………..23%
- Not sure………………….3%
|
|
Spring 2019 |
Spring 2020 |
Spring 2021 |
Spring 2022 |
|
Major Risk |
51% |
51% |
48% |
47% |
|
Minor Risk |
26% |
28% |
24% |
28% |
|
No Risk |
20% |
14% |
20% |
23% |
|
Not Sure |
4% |
8% |
9% |
3% |
Q22: Contaminated drinking water
- Major Risk………………59%
- Minor Risk………………31%
- No Risk………………….. 7%
- Not sure………………….3%
|
|
Spring 2021 |
Spring 2022 |
|
Major Risk |
53% |
59% |
|
Minor Risk |
37% |
31% |
|
No Risk |
6% |
7% |
|
Not Sure |
4% |
3% |
(DEMOGRAPHICS)
Q23: Finally, I have a few questions about yourself. First, what is your current marital status?
|
|
|
|
Single |
35% |
|
Married |
46% |
|
Separated |
1% |
|
Divorced |
8% |
|
Widowed |
5% |
|
Partnered |
5% |
|
Not sure |
1% |
Q24: What is your highest level of education? Is it (READ LIST)?
|
|
|
|
Less Than High School |
4% |
|
High School Graduate |
30% |
|
Some College Or Technical School |
29% |
|
College Graduate (4 Yr Only) |
24% |
|
Graduate Or Professional Degree |
12% |
Q25: Which of the following categories best describes your racial identity? (READ LIST)
|
|
|
|
White/Caucasian |
74% |
|
African-American |
12% |
|
Hispanic |
6% |
|
Latino |
2% |
|
Asian |
2% |
|
Native American |
1% |
|
Mixed Race |
3% |
|
Or Other |
1% |
Q26: Which of the following categories best describes your current voting status? Are you registered as a (READ LIST)?
|
|
|
|
Democrat |
40% |
|
Republican |
35% |
|
Independent |
13% |
|
Other Party |
4% |
|
Or Not Registered To Vote In Pennsylvania |
5% |
|
Not Sure |
3% |
Q27: Which of the following categories best describes your religious affiliation? Are you (READ LIST)?
|
|
|
|
Catholic |
25% |
|
Protestant |
32% |
|
Jewish |
2% |
|
Muslim |
1% |
|
Hindu |
1% |
|
Other Religion (Including Agnostic) |
31% |
|
Atheist |
6% |
|
Not Sure |
2% |
Q28: Do you have children under the age of 18?
|
|
|
|
Has Children Under 18 |
25% |
|
No Children Under 18 |
75% |
Q29: Which of the following best describes your health care insurance status. Are you primarily insured:
|
|
|
|
By A Plan Provided By Your Employer |
48% |
|
By A Plan That You Purchase Individually |
7% |
|
By Medicaid Coverage |
8% |
|
By Medicare Coverage |
25% |
|
Uninsured |
5% |
|
Other |
7% |
|
Not Sure |
1% |
Q30: In which of the following age categories does your current age fall. READ LIST
|
|
|
|
18-29 |
22% |
|
30-49 |
30% |
|
50-65 |
27% |
|
Over 65 |
22% |
Q31: Which of the following categories best describes your family income? (READ LIST)
|
|
|
|
Under $20,000 |
13% |
|
$20,000-$40,000 |
18% |
|
$40,000-$60,000 |
19% |
|
$60,000-$80,000 |
15% |
|
$80,000-$100,000 |
11% |
|
Over $100,000 |
20% |
|
Not Sure |
5% |
Q32: Finally, to which gender identity do you most identify? (READ LIST)
|
|
|
|
Male |
49% |
|
Female |
51% |
|
Transgender Male |
1% |
|
Transgender Female |
<1% |
|
Or you do not identify as male, female or transgender |
0% |