-460x112.jpg)
The following report contains the results of a telephone survey of (419) likely voters in the Commonwealth of Pennsylvania between October 23 and 28, 2020. Respondents were interviewed in English on both landlines (107) and cell phones (312). With a randomly selected sample of respondents the margin of error for the surveys is +/- 5.5% at a 95% level of confidence.
Key Findings:
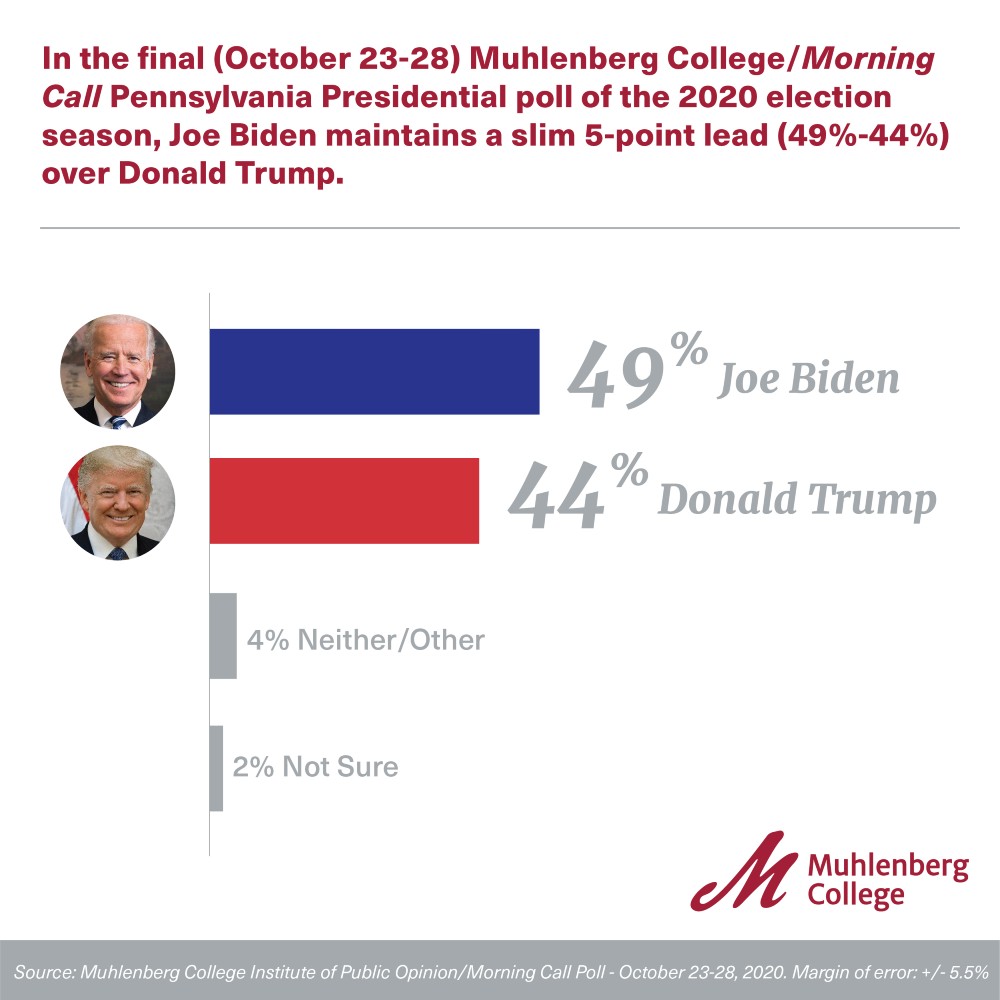
- In the final Muhlenberg College/Morning Call poll of the 2020 election season, former Vice President Joe Biden maintains a slim 5-point lead (49%-44%) over President Donald Trump in the race for Pennsylvania’s 20 Electoral College votes.
- Biden’s narrow lead is largely unchanged from last week when he led Trump 51% to 44% among likely Pennsylvania voters.
- A plurality (49%) of likely voters in the Keystone State disapprove of President Trump’s handling of his job, with 45% approving of the 45th President’s performance in office.
- As has been the case throughout the campaign, a majority (54%) of Pennsylvanians think that President Trump does not deserve reelection.
- While Biden has maintained a slim lead over Trump in all Muhlenberg College/Morning Call polls from August onward, more likely voters view him unfavorably (45%) than favorably (38%).
- Voters supporting President Trump are significantly more likely to be very enthusiastic (82%) about their choice, than voters supporting Biden (48%).
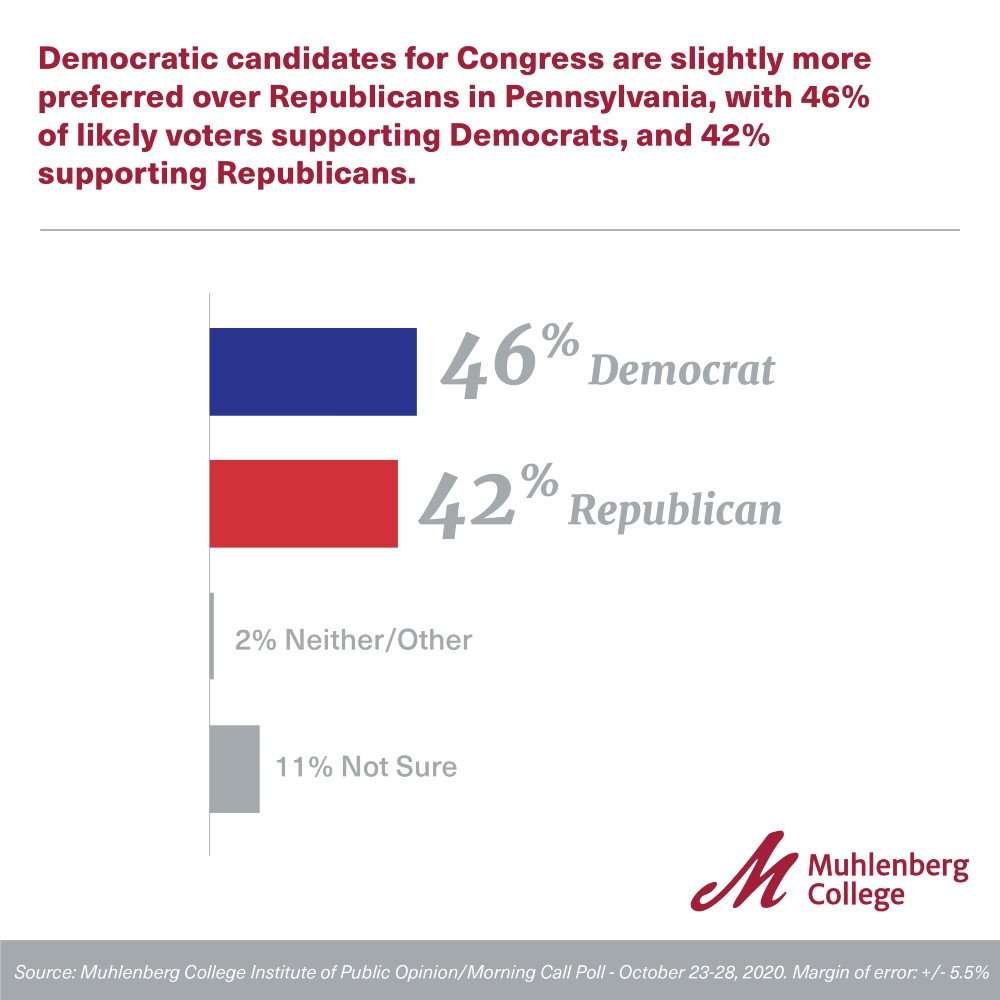
- Democratic candidates for Congress are slightly more preferred over Republicans in Pennsylvania, with 46% of likely voters supporting Democrats, and 42% supporting Republicans.
- The economy, health care, and the Coronavirus pandemic remain the top issues Pennsylvania voters say will affect their choice in the presidential race, with 27% identifying the economy, 22% selecting health care, and 20% choosing the Coronavirus pandemic.
- About 1 in 3 (34%) of poll respondents report that they have already cast their vote in the 2020 election.
Methodological Statement:
The following report contains the results of a telephone survey of (419) likely voters in the Commonwealth of Pennsylvania between October 23 and 28, 2020. Respondents were interviewed in English on both landlines (107) and cell phones (312). With a randomly selected sample of respondents the margin of error for the surveys is +/- 5.5% at a 95% level of confidence. Margins of error for questions with smaller sample size will be larger. In addition to sampling error, one should consider that question wording and other fielding issues can introduce error or bias into survey results. Interviewing was conducted by Communication Concepts of Easton, Pennsylvania under protocols established by the Muhlenberg College Institute of Public Opinion (MCIPO.) The data has been weighted to gender, age, region, party, race and educational attainment to reflect voter population parameters. The calculation of sampling error takes into account design effects due to the weighting identified above. In order to reach a representative sample of registered voters both land lines and cell phones were called up to 3 times. The sampling frame for the study is from the registered voters files of the Commonwealth of Pennsylvania. To determine likely voters, only voters who have voted in 1 or more of the last 4 general elections (2016-2019), or who is a new registrant since November of 2016 were included in the sampling frame. In addition, only survey respondents from this frame who indicated that they were “definitely” or “very likely” to vote in the November election were included in the sample. Due to rounding the totals provided in the frequency report may not total 100%. The survey instrument (presented in its entirety below) was designed by Christopher P. Borick, director of the Muhlenberg College Institute of Public Opinion (MCIPO), in conjunction with the staff of the Morning Call. The survey was funded exclusively by the Morning Call and the MCIPO. For more detailed information on the methods employed, please call 484-664-3444 or email [email protected].
Muhlenberg College/Morning Call Pennsylvania Presidential Election Survey
LATE OCTOBER 2020
FREQUENCY REPORT AND INSTRUMENT
Q1: Thank you. Which of the following categories best describes your current voting status? Are you registered as a ______? (READ LIST)
- Democrat……………………………………………………………47%
- Republican………………………………………………………….42%
- Independent…………………………………………………………10%
- Other Party……………………………………………………………1%
- Not Registered to Vote in Pennsylvania (END SURVEY)
Q2: How likely are you to vote in the presidential election this November? Are you definitely going to vote, very likely to vote, not too likely to vote or definitely not voting in the November Election?
- Definitely Going to Vote………………………………………….98%
- Very Likely to Vote……………………………………………… 2%
- Not Too Likely to Vote (END SURVEY)
- Definitely not voting (END SURVEY)
- Not Sure (Volunteered) (END SURVEY)
Q3: Next, do you approve or disapprove of the way Donald Trump is handling his job as President?
- Approve…………………………….....45%
- Disapprove…………………………...49%
- Not Sure (Volunteered)………….6%
TIME SERIES
|
|
NOVEMBER 2019 |
FEBRUARY 2020 |
AUGUST 2020 |
MID OCTOBER 2020 |
LATE OCTOBER 2020 |
|
Approve |
40% |
42% |
43% |
43% |
45% |
|
Disapprove |
56% |
50% |
51% |
51% |
49% |
|
Not Sure |
4% |
9% |
6% |
7% |
6% |
Q4: Now, I would like to ask your overall impression of a few political figures. For each name I read, please tell me if your impression of him is favorable or unfavorable. First, Donald Trump
- Favorable…………………………….41%
- Unfavorable...........…………..52%
- Neutral/Not Sure (Vol)…………7%
TIME SERIES
|
|
AUGUST 2020 |
MID OCTOBER 2020 |
LATE OCTOBER 2020 |
|
Favorable |
42% |
40% |
41% |
|
Unfavorable |
51% |
52% |
52% |
|
Neutral/Not Sure |
8% |
8% |
7% |
Q5: Next, Joe Biden
- Favorable…………………………….38%
- Unfavorable………………………….45%
- Neutral/Not Sure (Vol)…………17%
TIME SERIES
|
|
AUGUST 2020 |
MID OCTOBER 2020 |
LATE OCTOBER 2020 |
|
Favorable |
39% |
42% |
38% |
|
Unfavorable |
46% |
42% |
45% |
|
Neutral/Not Sure |
15% |
16% |
17% |
Q6: Do you think Donald Trump deserves to be re-elected as President, or not?
- Deserves re-election……………….42%
- Does not deserve re-elected……54%
- Not Sure (Volunteered)…………… 4%
TIME SERIES
|
|
NOVEMBER 2019 |
FEBRUARY 2020 |
AUGUST 2020 |
MID OCTOBER 2020 |
LATE OCTOBER 2020 |
|
Deserves re-election |
42% |
42% |
44% |
44% |
42% |
|
Does not deserve re-elected |
57% |
54% |
53% |
51% |
54% |
|
Not Sure |
2% |
4% |
3% |
5% |
4% |
Q7: Now, if the 2020 presidential election was being held today and the race was between Donald Trump and Joe Biden, would you vote for? (OPTIONS ROTATED)
- Trump ………………………….…43%
- Biden…………………………….. 49%
- Neither/Other ………………….4%
- Not Sure (Volunteered)……4%
TIME SERIES
|
|
NOVEMBER 2019 |
FEBRUARY 2020 |
AUGUST 2020 |
MID OCTOBER 2020 |
LATE OCTOBER 2020 |
|
Trump |
43% |
47% |
44% |
44% |
43% |
|
Biden |
52% |
47% |
48% |
51% |
49% |
|
Neither/Other |
4% |
2% |
3% |
2% |
4% |
|
Not Sure |
2% |
4% |
4% |
4% |
4% |
Q8: Are you leaning more toward voting for Donald Trump or Joe Biden? (OPTIONS ROTATED) (ASKED ONLY OF THOSE THAT SAID “NOT SURE” ON Q8: N =17)
- Trump …………………………….29%
- Biden……………………………...14%
- Not Sure (Volunteered)….56%
PRESIDENTIAL RACE INCLUDING LEANERS
- Trump……………………………….44%
- Biden…………………………………49%
- Neither/Other………………………4%
- Not Sure………………………………2%
TIME SERIES
|
|
AUGUST 2020 |
MID OCTOBER 2020 |
LATE OCTOBER 2020 |
|
Trump |
45% |
44% |
44% |
|
Biden |
49% |
51% |
49% |
|
Neither/Other |
3% |
2% |
4% |
|
Not Sure |
3% |
4% |
2% |
Q9: Would you say you are very enthusiastic about supporting Trump, somewhat enthusiastic, not so enthusiastic or not enthusiastic at all? (ASKED ONLY OF TRUMP VOTERS)
- Very Enthusiastic…………….82%
- Somewhat Enthusiastic ….14%
- Not So Enthusiastic ………….3%
- Not Enthusiastic at All ………1%
Q10: Would you say you are very enthusiastic about supporting Biden, somewhat enthusiastic, not so enthusiastic or not enthusiastic at all? (ASKED ONLY OF BIDEN VOTERS)
- Very Enthusiastic……………..48%
- Somewhat Enthusiastic……36%
- Not So Enthusiastic………….15%
- Not Enthusiastic at All……….1%
Q11: If the election for U.S. House of Representatives was held today, would you vote for the Republican or the Democratic candidate in your Congressional district? (ROTATE OPTIONS)
- Democrat ……………………....46%
- Republican……………………...42%
- Other (Volunteered)………….1%
- Not Sure (Volunteered)……11%
TIME SERIES
|
|
AUGUST 2020 |
MID OCTOBER 2020 |
LATE OCTOBER 2020 |
|
Democrat |
45% |
47% |
46% |
|
Republican |
38% |
41% |
42% |
|
Other |
1% |
2% |
1% |
|
Not Sure |
17% |
11% |
11% |
Q12: Which of the following issues do you consider the most important in your choice of candidates in the presidential race? (Rotate Choices)
- The Economy……………….........27%
- Health Care…………………….......22%
- The Coronavirus Pandemic…..20%
- Law and Order……………............8%
- Racial Justice………………….........7%
- National Security…………..........4%
- Other Issue (Vol) …………….......9%
Q13: Overall, would you say that your financial situation is better, worse or about the same since President Trump took office in 2017?
- Better……………………….37%
- Worse………………………13%
- About the Same………49%
- Not Sure (Vol)……………1%
TIME SERIES
|
|
FEBRUARY 2020 |
AUGUST 2020 |
MID OCTOBER 2020 |
LATE OCTOBER 2020 |
|
Better |
40% |
40% |
36% |
37% |
|
Worse |
11% |
10% |
16% |
13% |
|
About the Same |
48% |
47% |
46% |
49% |
|
Not Sure |
1% |
2% |
2% |
1% |
Q14: Now thinking ahead to the November election, do you plan to vote in person at a polling station, or vote by mail?
- Vote in Person……………………….64%
- Vote by Mail…………………………..35%
- Not sure (VOL) ……………………… 2%
TIME SERIES
|
|
AUGUST 2020 |
MID OCTOBER 2020 |
LATE OCTOBER 2020 |
|
Vote in Person |
64% |
62% |
64% |
|
Vote by Mail |
26% |
35% |
35% |
|
Not Sure |
10% |
2% |
2% |
Q15: Have you already cast your ballot in the 2020 Presidential election?
- Yes……………………….34%
- No………………………..66%
Q16: Which of the following best describes your activity in the 2016 Presidential Election? Did you vote for:
- Donald Trump ……………………………......41%
- Hillary Clinton ……………………………......40%
- Some other candidate ……………………....5%
- Or did you not vote in that election….11%
- Not Sure………………………………...............2%
Q17: Finally, I have a few questions about yourself. Which of the following categories best describes your racial identity? Are you (READ LIST)?
- White/Caucasian………………. 80%
- African-American……………….10%
- Hispanic/Latino………………... 5%
- Asian………………………….........2%
- Native American………………<1%
- Mixed race……………………......2%
- or other………………………........1%
Q18: Which of the following categories best describes your religious affiliation? Are you (READ LIST)
- Catholic…………………………….......29%
- Protestant……………………………....37%
- Jewish………………………………........3%
- Muslim……………………………….......1%
- Hindu………………………………........<1%
- Other Religion (Including agnostic)…..24%
- or Atheist…………………………….......6%
- Not Sure (Volunteered)……………<1%
Q19: What is your highest level of education? (READ LIST)
- Less than High School……………….....1%
- High School Graduate……………….....33%
- Some college or technical school….28%
- College graduate (4 yr only)………….23%
- Graduate or professional degree…..15%
Q20: Which of the following categories best describes your family income? Is it (READ LIST)?
- Under $20,000………………......9%
- $20,000-$40,000……………...14%
- $40,000-$60,000……………...18%
- $60,000-$80,000……………...17%
- $80,000-$100,000…………….10%
- Over $100,000……………….....26%
- Not Sure (Volunteered)……...7%
Q21: In which of the following age categories does your current age fall. READ LIST _______
- 18-29……………..18%
- 30-49……………..29%
- 50-65……………..31%
- or Over 65….…..23%
Q22: Finally, to which gender identity do you most identify? (READ LIST)
- Male………………………………………………49%
- Female………………………………………….51%
Trump vs. Biden (CROSSTABS)
|
|
Trump |
Biden |
Neither/Other/Not Sure |
|
OVERALL |
44% |
49% |
6% |
|
Male (49%) |
49% |
43% |
8% |
|
Female (51%) |
40% |
55% |
5% |
|
Democrat (47%) |
12% |
84% |
4% |
|
Republican (42%) |
84% |
11% |
5% |
|
Independent (10%) |
26% |
54% |
11% |
|
College Degree (38%) |
35% |
59% |
5% |
|
No College Degree (62%) |
50% |
44% |
6% |
|
White (80%) |
52% |
44% |
4% |
|
Non-White (20%) |
20% |
67% |
13% |
|
Philadelphia (13%) |
18% |
75% |
7% |
|
Philadelphia Suburbs (20%) |
28% |
66% |
7% |
|
Alleghany County (10%) |
40% |
50% |
10% |
|
Northeast PA (12%) |
58% |
33% |
8% |
|
Remainder of State (45%) |
58% |
35% |
6% |
|
18-29 (18%) |
29% |
62% |
9% |
|
30-49 (29%) |
42% |
52% |
6% |
|
50-64 (31%) |
52% |
39% |
9% |
|
65 and Over (23%) |
47% |
51% |
2% |
|
Catholic (29%) |
51% |
48% |
1% |
|
Protestant (37%) |
59% |
33% |
9% |
|
Other/Agnostic/Atheist (35%) |
28% |
64% |
8% |
|
Mail Ballot (35%) |
17% |
79% |
4% |
|
In Person (64%) |
59% |
34% |
7% |
|
Trump Vote 2016 (41%) |
96% |
2% |
2% |
|
Clinton Vote 2016 (40%) |
4% |
94% |
2% |