Winter 2021 - National Surveys on Energy & Environment
The following key findings and full report are from the Winter 2021 wave of the National Surveys on Energy and Environment (NSEE). This survey wave marks the 24th in the series, dating back to the project’s origin in 2008, under a partnership between Muhlenberg College and the University of Michigan. Beginning in 2020, the NSEE has been produced exclusively by the Muhlenberg College Institute of Public Opinion.
PDF - WINTER 2021 - National Surveys on Energy & Environment
KEY FINDINGS
-
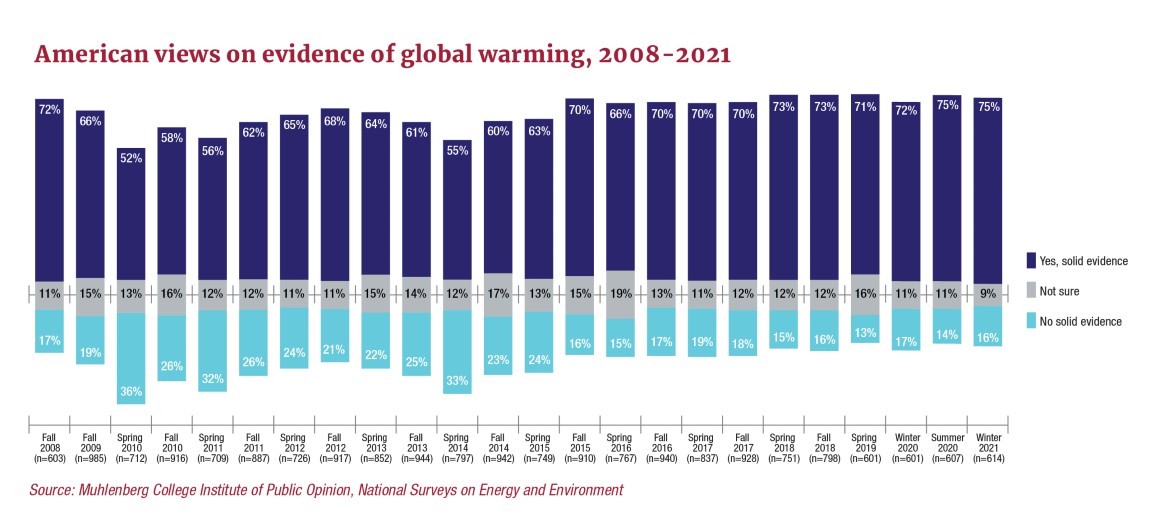
American acceptance of global warming remains at a record high level.
The Winter 2021 NSEE results show 75% of adult Americans believe there is solid evidence that temperatures on the planet have risen over the last four decades. This 75% level is identical to the Summer 2021 NSEE result that established the highest level of acceptance since the project began in 2008. The most recent survey marks the 9th consecutive survey wave, dating back to 2016, in which at least 70% of Americans indicated there was solid evidence of global warming. This consistently high level of acceptance of climate change suggests Americans have arrived at a more durable position in terms of views on the existence of this challenge.
-
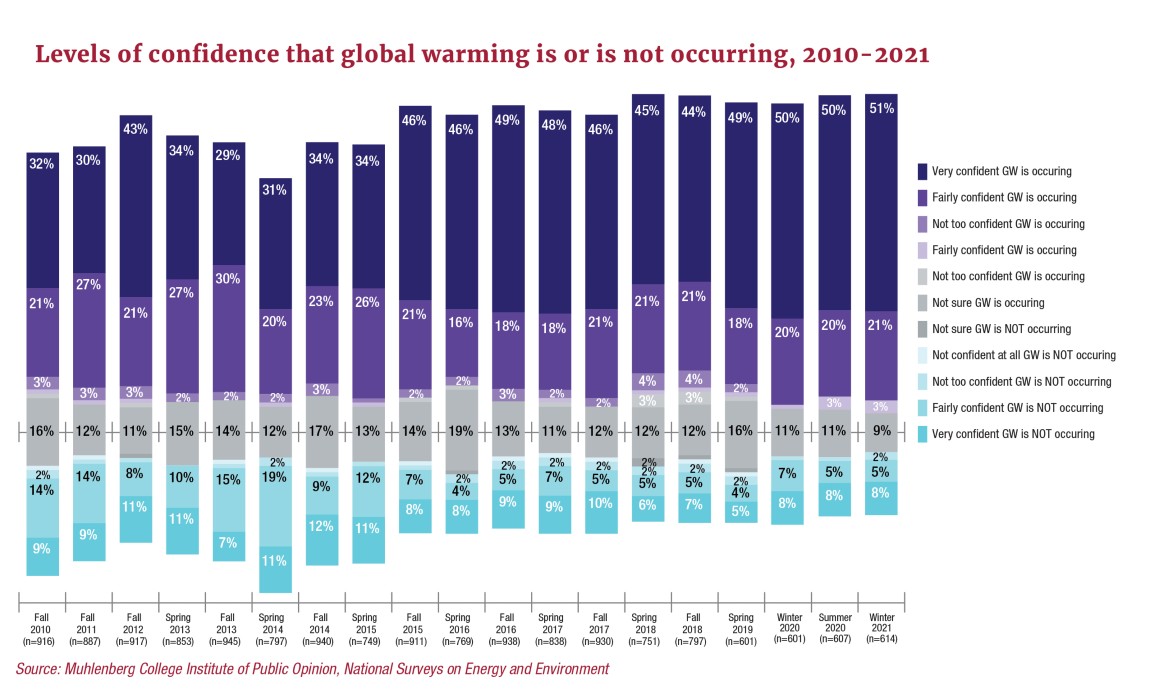
In addition to record-high acceptance of climate change, Americans have become more confident in their view that the planet is warming.
As acceptance of climate change has reached record levels in the United States over the last year, confidence in these appraisals has also reached record levels. In the most recent NSEE wave, over half of American adults indicated that they are “very confident” that global warming is happening. The 51% indicating that they are very confident global warming is occurring is the highest level recorded since the NSEE first measured this aspect of opinion on climate change in the fall of 2010.
-
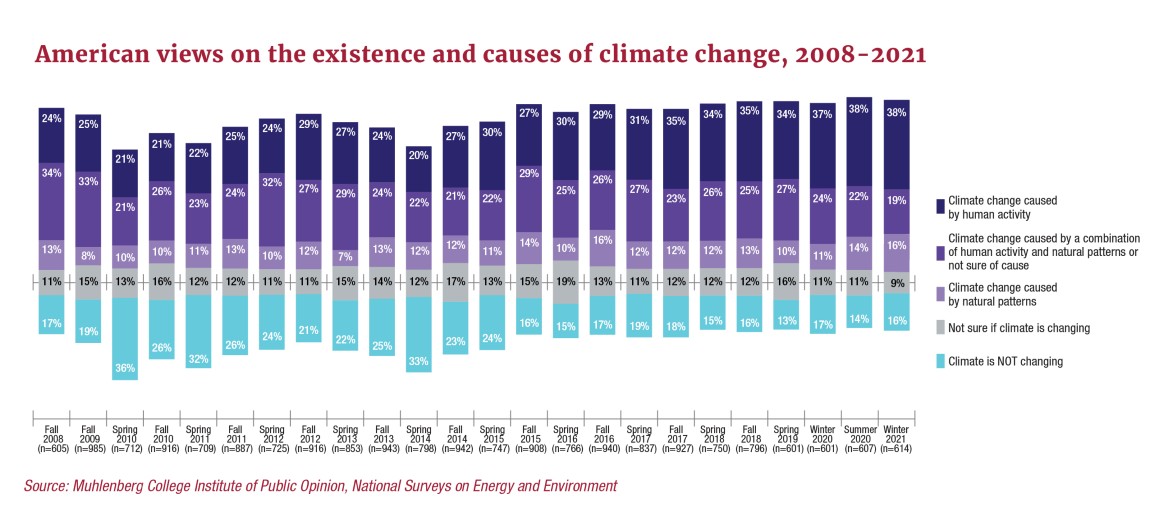
Wide acceptance of human roles in causing global warming
Nearly 6 in 10 adult Americans indicate that there is strong evidence of global warming and that humans are at least partially responsible for this phenomenon. In February, 38% of Americans indicated that there is solid evidence of a warming planet and that the warming is caused primarily by human activity. An additional 19% of Americans agreed there is solid evidence of global warming, and that humans are at least partially responsible for these changes. While a majority (57%) of Americans believe humans are contributing to increased temperatures on earth, 16% indicate that while there is solid evidence of global warming, the warming is the result of a natural cycle.
-
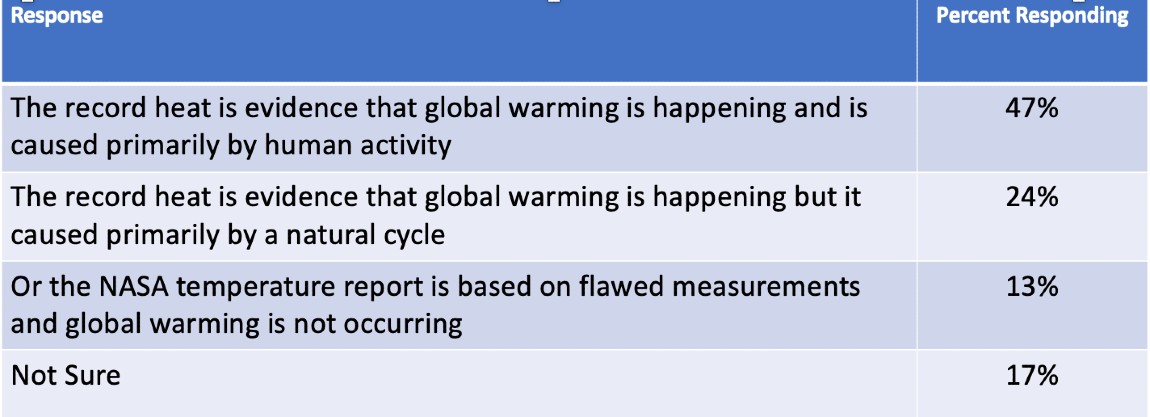
Most Americans attribute 2020’s record warmth to broader effects of global warming.
In early 2021, NASA released a report that indicated 2020 was tied with 2016 as the hottest year on the planet since record keeping began in 1880. The NSEE included a question that examined American reactions to this finding. The survey results show about half (47%) of Americans indicated the findings of record heat in the NASA report was evidence of human-induced global warming, with an additional quarter (24%) saying the record heat was a sign of global warming, but that the heating was caused primarily by a natural cycle. Only 13% of Americans indicated the NASA finding was based on flawed measurement and that global warming was not happening.
-
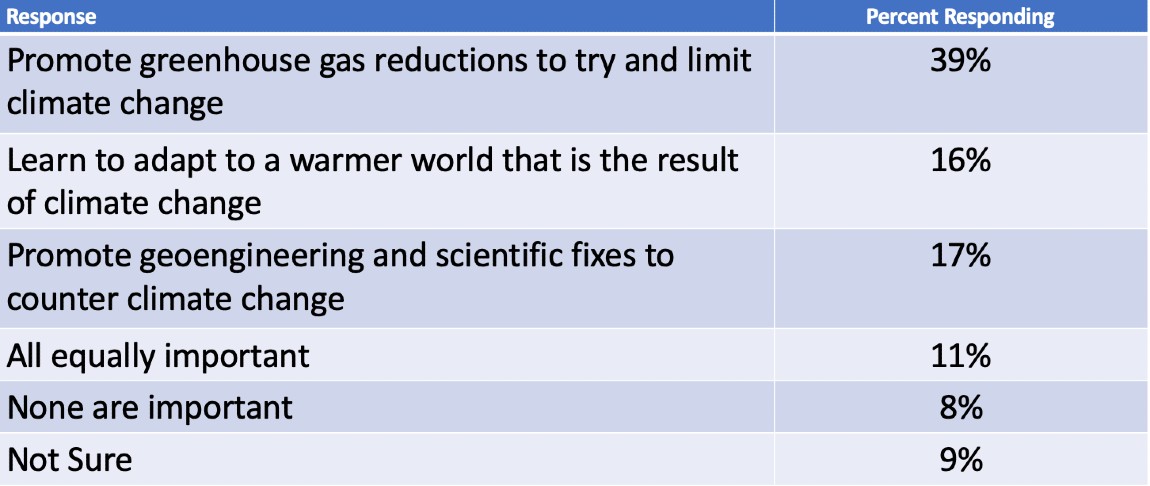
Americans have varied views on the most important elements of climate policy, with mitigation efforts most commonly identified, but significant portions prioritize adaptation and geoengineering.
The Winter 2021 NSEE included a question asking Americans what type of actions are most important for the United States to take to address climate change. About 4 in 10 (39%) selected policies aimed at reducing greenhouse gas emissions as the most important policy approach. Fairly equal numbers of adult Americans indicated policies to adapt to a warmer world (16%) or promote geoengineering to counter climate change (17%) as their preferred priority for the nation.
METHODS
The following report contains the results of a telephone survey of 614 adult residents of the United States between February 4 and 20, 2021. Respondents were interviewed in English on both landlines (111) and cell phones (503). With a randomly selected sample of respondents, the margin of error for the surveys is +/- 5% at a 95% level of confidence. Margins of error for questions with a smaller sample size will be larger. In addition to sampling error, one should consider that question wording and other fielding issues could introduce error or bias into survey results. Interviewing was conducted by Communication Concepts of Easton, Pennsylvania, under protocols established by the Muhlenberg College Institute of Public Opinion (MCIPO). The sample data has been weighted by gender, race, age, income and educational attainment to reflect national population characteristics as reported by the United States Census Bureau in 2020. The calculation of sampling error takes into account design effects due to the weighting identified above. In order to reach a representative sample of adult residents of the United States, both landlines and cell phones are called up to 5 times. The response rate for this survey as calculated using the American Association of Public Opinion Research (AAPOR) RRII formula is approximately 7%. Due to rounding the totals provided in the frequency report may not total 100%. The survey instrument, presented in its entirety in the following section, was designed by Dr. Christopher P. Borick, Director of the Muhlenberg College Institute of Public Opinion, and Professor of Political Science, in conjunction with Dr. Barry Rabe of the University of Michigan, and Dr. Erick Lachapelle of the University of Montreal. The survey was funded exclusively by Muhlenberg College. For more detailed information on the methods employed, please contact the MCIPO at 484-664-3444 or email Dr. Borick at [email protected].
SURVEY INSTRUMENT AND FREQUENCY REPORT
Fielding Dates: February 4 – February 20, 2021
Sample Size: 614 Adults in the United States
Method: Telephone (82% Cell and 18% Landline)
Margin of Error: +/- 5%
AAPOR Response Rate (II): 7%
Totals may not equal 100% due to rounding
My name is ___________________. We are conducting a research project regarding environmental issues in the United States. Would you be able to help us by answering a few questions?
Yes......................1
No.......................2 (Thank and terminate)
Not sure............98 (Thank and terminate)
Refused........... .99 (Thank and terminate)
Q1. Thank you. Can you please tell me in which year you were born? (GROUPED INTO CATEGORIES)
- 18-29………….….21%
- 30-44……………..24%
- 45-64……………..31%
- 65 and Older….24%
Q2. What state do you currently reside in? (GROUPED INTO REGIONS)
- Northeast………….19%
- South………………...35%
- Midwest…………….24%
- West……………….…22%
Q3. Next, I would like to ask you a few questions on the issue of global warming. From what you’ve read and heard. Is there solid evidence that the average temperature on earth has been getting warmer over the past four decades?
- Yes .…………..…………………...........75%
- No ..…………..…………………………...16% (SKIP TO Q8)
- Not Sure (Volunteered)………….. 9% (SKIP TO Q10)
Q4. How confident are you that the average temperature on earth is increasing? Are you very confident, fairly confident, not too confident or not confident at all that the average temperature on earth is increasing?
- Very confident…..…………………. 68%
- Fairly confident…..………………....28%
- Not too confident….……………….. 4%
- Not confident at all………………… <1%
- Not Sure (Volunteered)…….…….. 1%
Q5. Is the earth getting warmer mostly because of human activity such as burning fossil fuels, or mostly because of natural patterns in the earth’s environment?
- Human activity…………………………..…..….. 50% Skip to Q7
- Natural patterns………………………………..…21% Skip to Q7
- A combination (Volunteered)………...…...25% (Go to Q6)
- Not Sure (Volunteered)……………………... 4% Skip to Q7
Q6. I know you say it’s a combination, but if you had to choose, would you say that temperatures on earth are rising mostly because of human activity or mostly because of natural patterns?
- Human activity………………………..….. 63%
- Natural patterns…………………………… 15%
- Equal (Volunteered)……………………… 21%
- Not Sure (Volunteered)…………………. 1%
Q7. What is the primary factor that has caused you to believe that temperatures on earth are increasing?
- Scientific Research…………………………. 14%
- Weather Changes…………………………… 16%
- Warmer Temperatures Observed……. 12%
- Human Activity…………………………….... 27%
- Melting Glaciers/Polar Ice……………..... 11%
- Media Coverage……………………………..... 3%
- Natural Patterns………………………………. 6%
- Ocean Changes………………………………. 1%
- Wildfires……………………………………... 1%
- Declining Species…..……………………….. <1%
- Not Sure/Other………………………………. 9%
ONLY THOSE WHO ANSWERED “NO” IN Q3 (i.e., do not believe temperatures are increasing)
Q8. How confident are you that the average temperatures on earth are NOT increasing? Are you very confident, fairly confident, not too confident or not confident at all that the average temperature on earth is NOT increasing?
- Very confident…………………………………..50%
- Fairly confident……….…………………………34%
- Not too confident………………………………11%
- Not confident at all……………………………. 5%
Q9. What is the primary factor that makes you believe that temperatures on earth are not increasing?
- Natural Patterns/Cycles……………………….33%
- Personal Observations………………………….30%
- Evidence Disproves……………………………...12%
- Lack of Evidence…………………………………….4%
- Religious Factors…………………………………...4%
- Political Factors…………………………………... 3%
- Media has Misled………………………………… 1%
- Not Sure/Other…………………………………… 14%
**ALL RESPONDENTS**
Q10. In your view is global warming a very serious problem, somewhat serious, not too serious, or not a problem?
- Very serious…………………...…… 47%
- Somewhat serious………………..21%
- Not too serious………………...….15%
- Not a problem………………….…. 14%
- Not Sure (Volunteered)…….…… 4%
(QUESTIONS Q11 to Q20 ROTATED)
Please identify your level of agreement with the following statements. For each statement please indicate if you strongly agree, somewhat agree, somewhat disagree or strongly disagree. First,
|
|
Strongly Agree |
Somewhat Agree |
Somewhat Disagree |
Strongly Disagree
|
Not Sure (Vol) |
|
NOTE: Q11 IS A SPLIT SAMPLE EXPERIMENT Q11A: Methane releases need to be limited by stronger government regulation because these releases are a waste of a natural resource that could be used to provide energy. |
20% |
30% |
9% |
17% |
25% |
|
Q11B: Methane releases need to be limited by stronger government regulation because methane is a powerful greenhouse gas that accelerates climate change. |
34% |
20% |
5% |
20% |
21% |
|
Q12: Americans will not make major changes in their lifestyles, so the best way to reduce greenhouse gases will be through technological advancements. |
29% |
39% |
10% |
11% |
11% |
|
Q13: Removing large amounts of carbon dioxide from the atmosphere, and storing the gas underground should be a major goal of United States climate policy. |
10% |
18% |
11% |
26% |
36% |
|
Q14. I have personally felt the effects of climate change. |
28% |
28% |
18% |
21% |
4% |
|
Q15: If global warming does take place I have confidence that scientists would be able to find ways to alter the climate in a way that limits problems. |
14% |
27% |
17% |
28% |
15% |
|
Q16: Attempts to reduce global warming by adding materials to the atmosphere will cause more harm than good for the environment. |
39% |
21% |
5% |
4% |
31% |
|
Q17: If human activity leads to global warming then humans will also be able to find ways to reduce temperatures on the planet through atmospheric engineering methods. |
11% |
31% |
13% |
17% |
29% |
|
Q18: Instead of trying to stop global warming from occurring we should focus on adapting to a warmer climate. |
8% |
24% |
20% |
38% |
11% |
|
Q19: Humans will be able to adapt to a hotter climate without making significant changes to their lifestyles. |
9% |
23% |
25% |
37% |
7% |
Q20: NASA recently reported that 2020 was tied with 2016 as the hottest year on the planet since record keeping began in 1880. Which of the following best describes your view on the NASA report that 2020 was the hottest year since 1880? (READ LIST)
- The record heat is evidence that global warming is happening and is caused primarily by human activity…………….47%
- The record heat is evidence that global warming is happening but it caused primarily by a natural cycle……………….24%
- Or the NASA temperature report is based on flawed measurements and global warming is not occurring……………...13%
- Not Sure (Vol)……………..17%
Q21: Next I’m going to read you a list of actions that the United States may take to address climate change. Which of the actions to you believe is the MOST important action the United States should take? [READ LIST]
- Promote greenhouse gas reductions to try and limit climate change…….. 39%
- Learn to adapt to a warmer world that is the result of climate change……16%
- Promote geoengineering and scientific fixes to counter climate change….17%
- All equally important (VOLUNTEERED)………………………………..11%
- None are important (VOLUNTEERED)………………………………….. 8%
- Not Sure (VOLUNTEERED)…………………………………………….. 9%
Q22. If it required you to pay extra money each year in order for more renewable energy to be produced, how much would you be willing to pay? Would you be willing to pay… [READ LIST]
- Nothing each year…………………………… 43%
- 1 to 50 dollars per year……………………..11%
- 50 to 100 dollars a year…………………….. 9%
- 100 to 250 dollars a year……………….…..10%
- 250 to 500 dollars a year……………….…..10%
- Over 500 dollars a year…………………….. 9%
- Not Sure (Volunteered)………………..…. 8%
Q23: In any election, some people are not able to vote because they are sick or busy, or for some other reason. Others do not want to vote. Did you vote in the 2020 Presidential Election?
- Yes………………………………………… 77%
- No…………………………………………..19% SKIP TO Q29
- Not Sure…………………………………….. 4% SKIP TO Q29
ONLY RESPONDENTS THAT VOTED IN 2020 PRESIDENTIAL ELECTION
Q24: Which candidate did you vote for in the 2020 Presidential Election? (READ LIST)
- Donald Trump………………43%
- Joe Biden……………………50%
- Another Candidate…………..6%
- Not Sure……………………. 1%
Now for each item I mention, please tell me if that issue was very important, somewhat important, not too important or not important at all in determining your vote in the 2020 presidential election: (READ LIST) (ROTATE OPTIONS)
|
|
Very Important |
Somewhat Important |
Not Too Important |
Not Important at All |
Not Sure (Vol.) |
|
Q25: Jobs and the economy |
76% |
17% |
6% |
2% |
<1% |
|
Q26: Government ethics and accountability |
81% |
12% |
5% |
1% |
<1% |
|
Q27: Healthcare and the COVID-19 pandemic |
64% |
21% |
10% |
5% |
<1% |
|
Q28: Climate change and the environment |
43% |
26% |
15% |
15% |
0% |
ALL RESPONDENTS
Q29: To what extent do you support or oppose putting a price or tax on fossil fuels like coal, oil, and gas in order to reduce carbon emissions in the United States? (READ LIST)
- Strongly support……………………..….23%
- Somewhat support………………………17%
- Neither support nor oppose…………11%
- Somewhat oppose………………………. 9%
- Strongly oppose………………………....34%
- Not Sure…………………………………. 7%
Q30: To what extent do you support or oppose expanding oil and gas pipelines in The United States – such as the proposed expansion of the Keystone XL pipeline from Canada to the Gulf of Mexico?
- Strongly support………………………….23%
- Somewhat support……………………..…17%
- Neither support nor oppose…………11%
- Somewhat oppose………………..………..9%
- Strongly oppose…………………………...34%
- Not Sure…………..……………………..….7%
Q31. Finally a few questions about yourself. Which of the following categories best describes your racial identity? Are you… [READ LIST]
- White/Caucasian………………………….60%
- African-American……….………………..12%
- Hispanic/Latino…………………………...16%
- Asian………….………….......................5%
- Native American………....................1%
- Mixed race..……………..………………... 4%
- Other .…………………………………..……… 1%
- Not Sure (Volunteered)…...............<1%
Q32. Which of the following categories best describes your religious affiliation? Are you… [READ LIST]
- Protestant…………………………………. 33%
- Catholic………………………………....…. 26%
- Jewish..……………………………………... 2%
- Muslim .…………………………………..… 1%
- Hindu………….…………………………..... 1%
- Other religion (including agnostic)… 27%
- Atheist..…………………………………………. 8%
- Not Sure (Volunteered)…………………… 3%
Q33. Which of these statements comes closest to describing your feelings about the Bible? [READ LIST]
- The Bible is the actual word of God and is to be taken literally, word for word………………………..…22%
- The Bible is the inspired word of God but not everything in it should be taken literally, word for word …………………………..52%
- The Bible is an ancient book of fables, legends, history and moral precepts recorded by men……………………………19%
- Not Sure (Volunteered)……………………….7%
Q34. What is your highest level of education? [READ LIST]
- Less than High School Graduate……………………. 3%
- High School Graduate……………………………………27%
- Some college or technical school…………………..30%
- College graduate…………………………………………...24%
- Graduate or professional degree…………………...16%
Q35. Which of the following best describes your political party affiliation? [READ LIST]
- Democrat………………………..……………….…. 30%
- Republican………….…...…………………………...27%
- Other party..……………………………………....….11%
- Independent .…………………………………………33%
Q36. Which of the following best describes your political beliefs? [READ LIST]
- Very Conservative…………………………………….14%
- Somewhat Conservative……………………………22%
- Moderate………………………………………………….35%
- Somewhat Liberal……………………………………..15%
- Very Liberal………………………………………………… 9%
- Not sure (Volunteered)…………………………………6%
Q37. Which of the following categories best describes your family income? Is it… [READ LIST]
- Less than 20,000……………………………………....12%
- 20,000-40,000……...................................17%
- 40,000-60,000…………………………………….….... 18%
- 60,000-80,000…….................................…16%
- 80,000-100,000………………………………….……….12%
- Over 100,000……………………………………….…….. 23%
- Not Sure (Volunteered) …………………………..….. 2%
Q38. What is the zip code of your current residence?
Q39. Finally, to which gender identity do you most identify? (READ LIST)
- Male……………………………………………………49%
- Female…………………………………………………50%
- Transgender Male…………………………………1%
- Transgender Female………………………………0%
- Do Not Identify as Male, Female or Transgender...0%